Log In
Sign Up
Donors
Oral History
ㅤ
Home
Browse
FAQS
Contact
Rights
Search results
All
Photos
Videos
Narrow your search
Narrow your search
Branch of Service
US Navy (11)
Apply US Navy filter
US Army (2)
Apply US Army filter
Theater
Pacific Theater of Operations (PTO) (5)
Apply Pacific Theater of Operations (PTO) filter
Home Front (2)
Apply Home Front filter
Refine your search
Sort by:
Relevance
Date added
Grid
Map
The map only displays records that have geographic information. Switch to the
grid view
to see all records.
Map is loading...
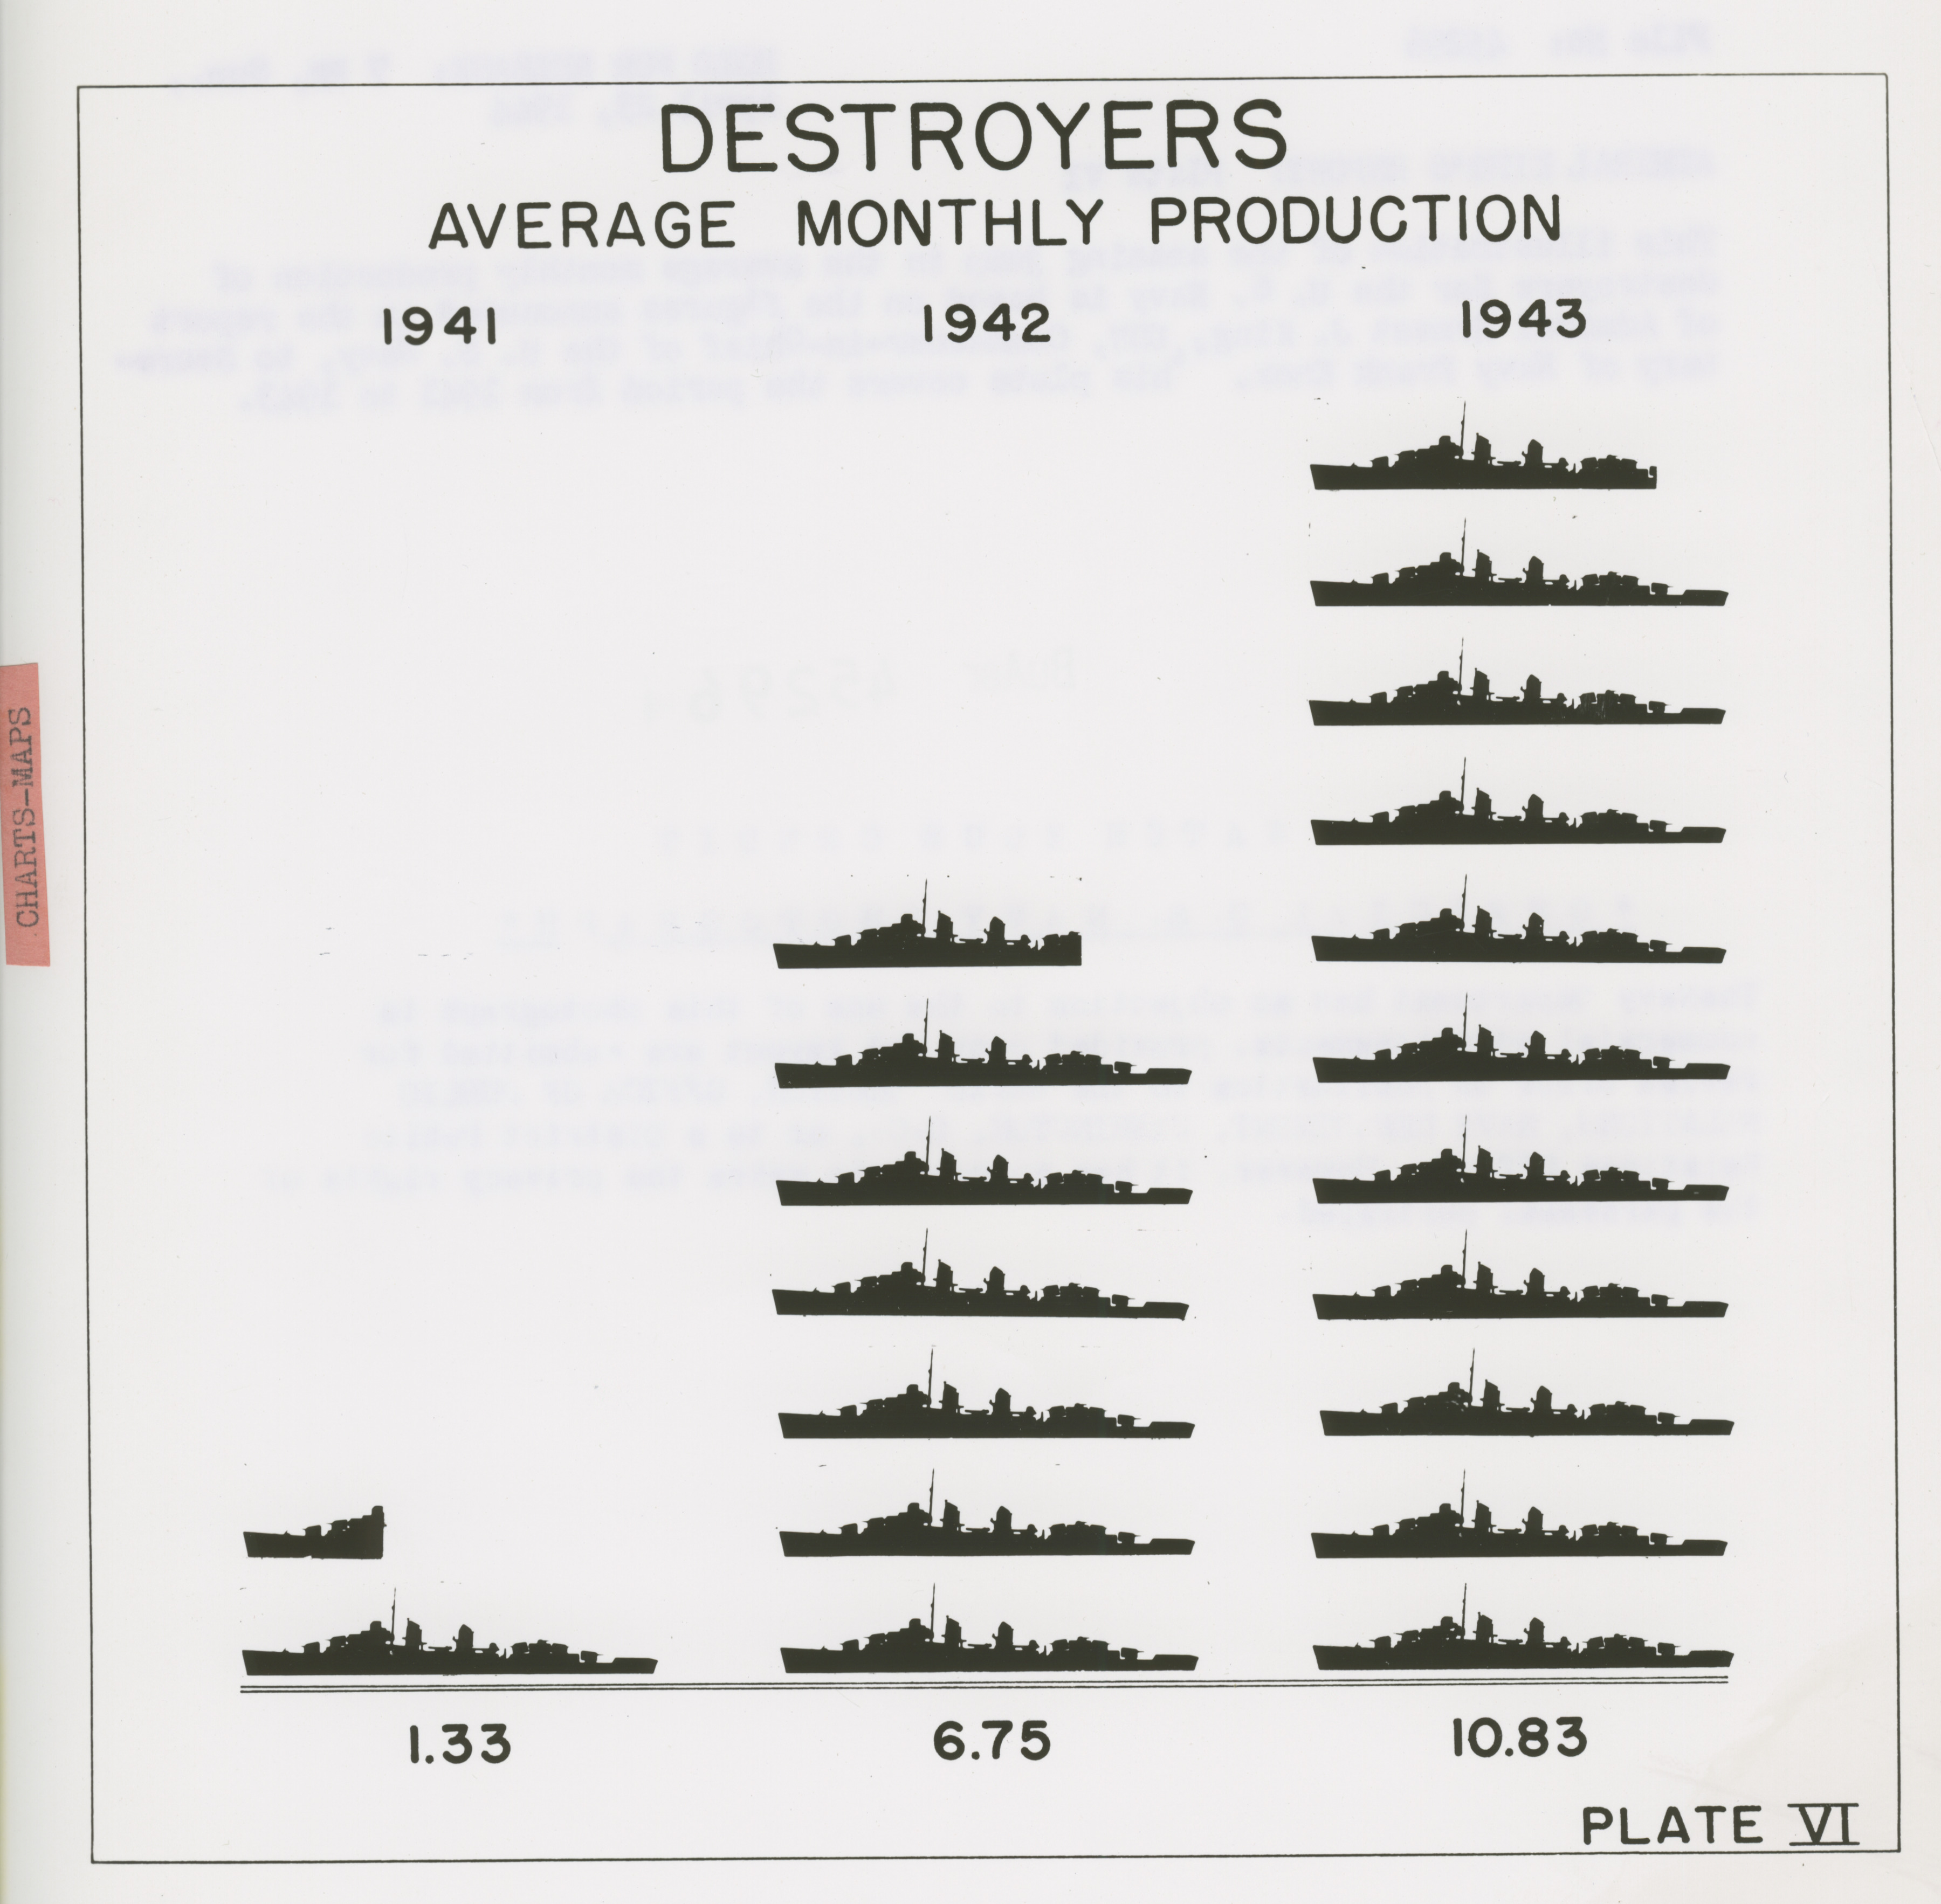
Jump in the average monthly production of destroyers for the U. S. Navy from 1941 to 1943 in April 1944
443.Photograph. Official U. S. Navy Chart 'File No: 45296 April 23, 1944 Admiral King's Report: Plate VI This...
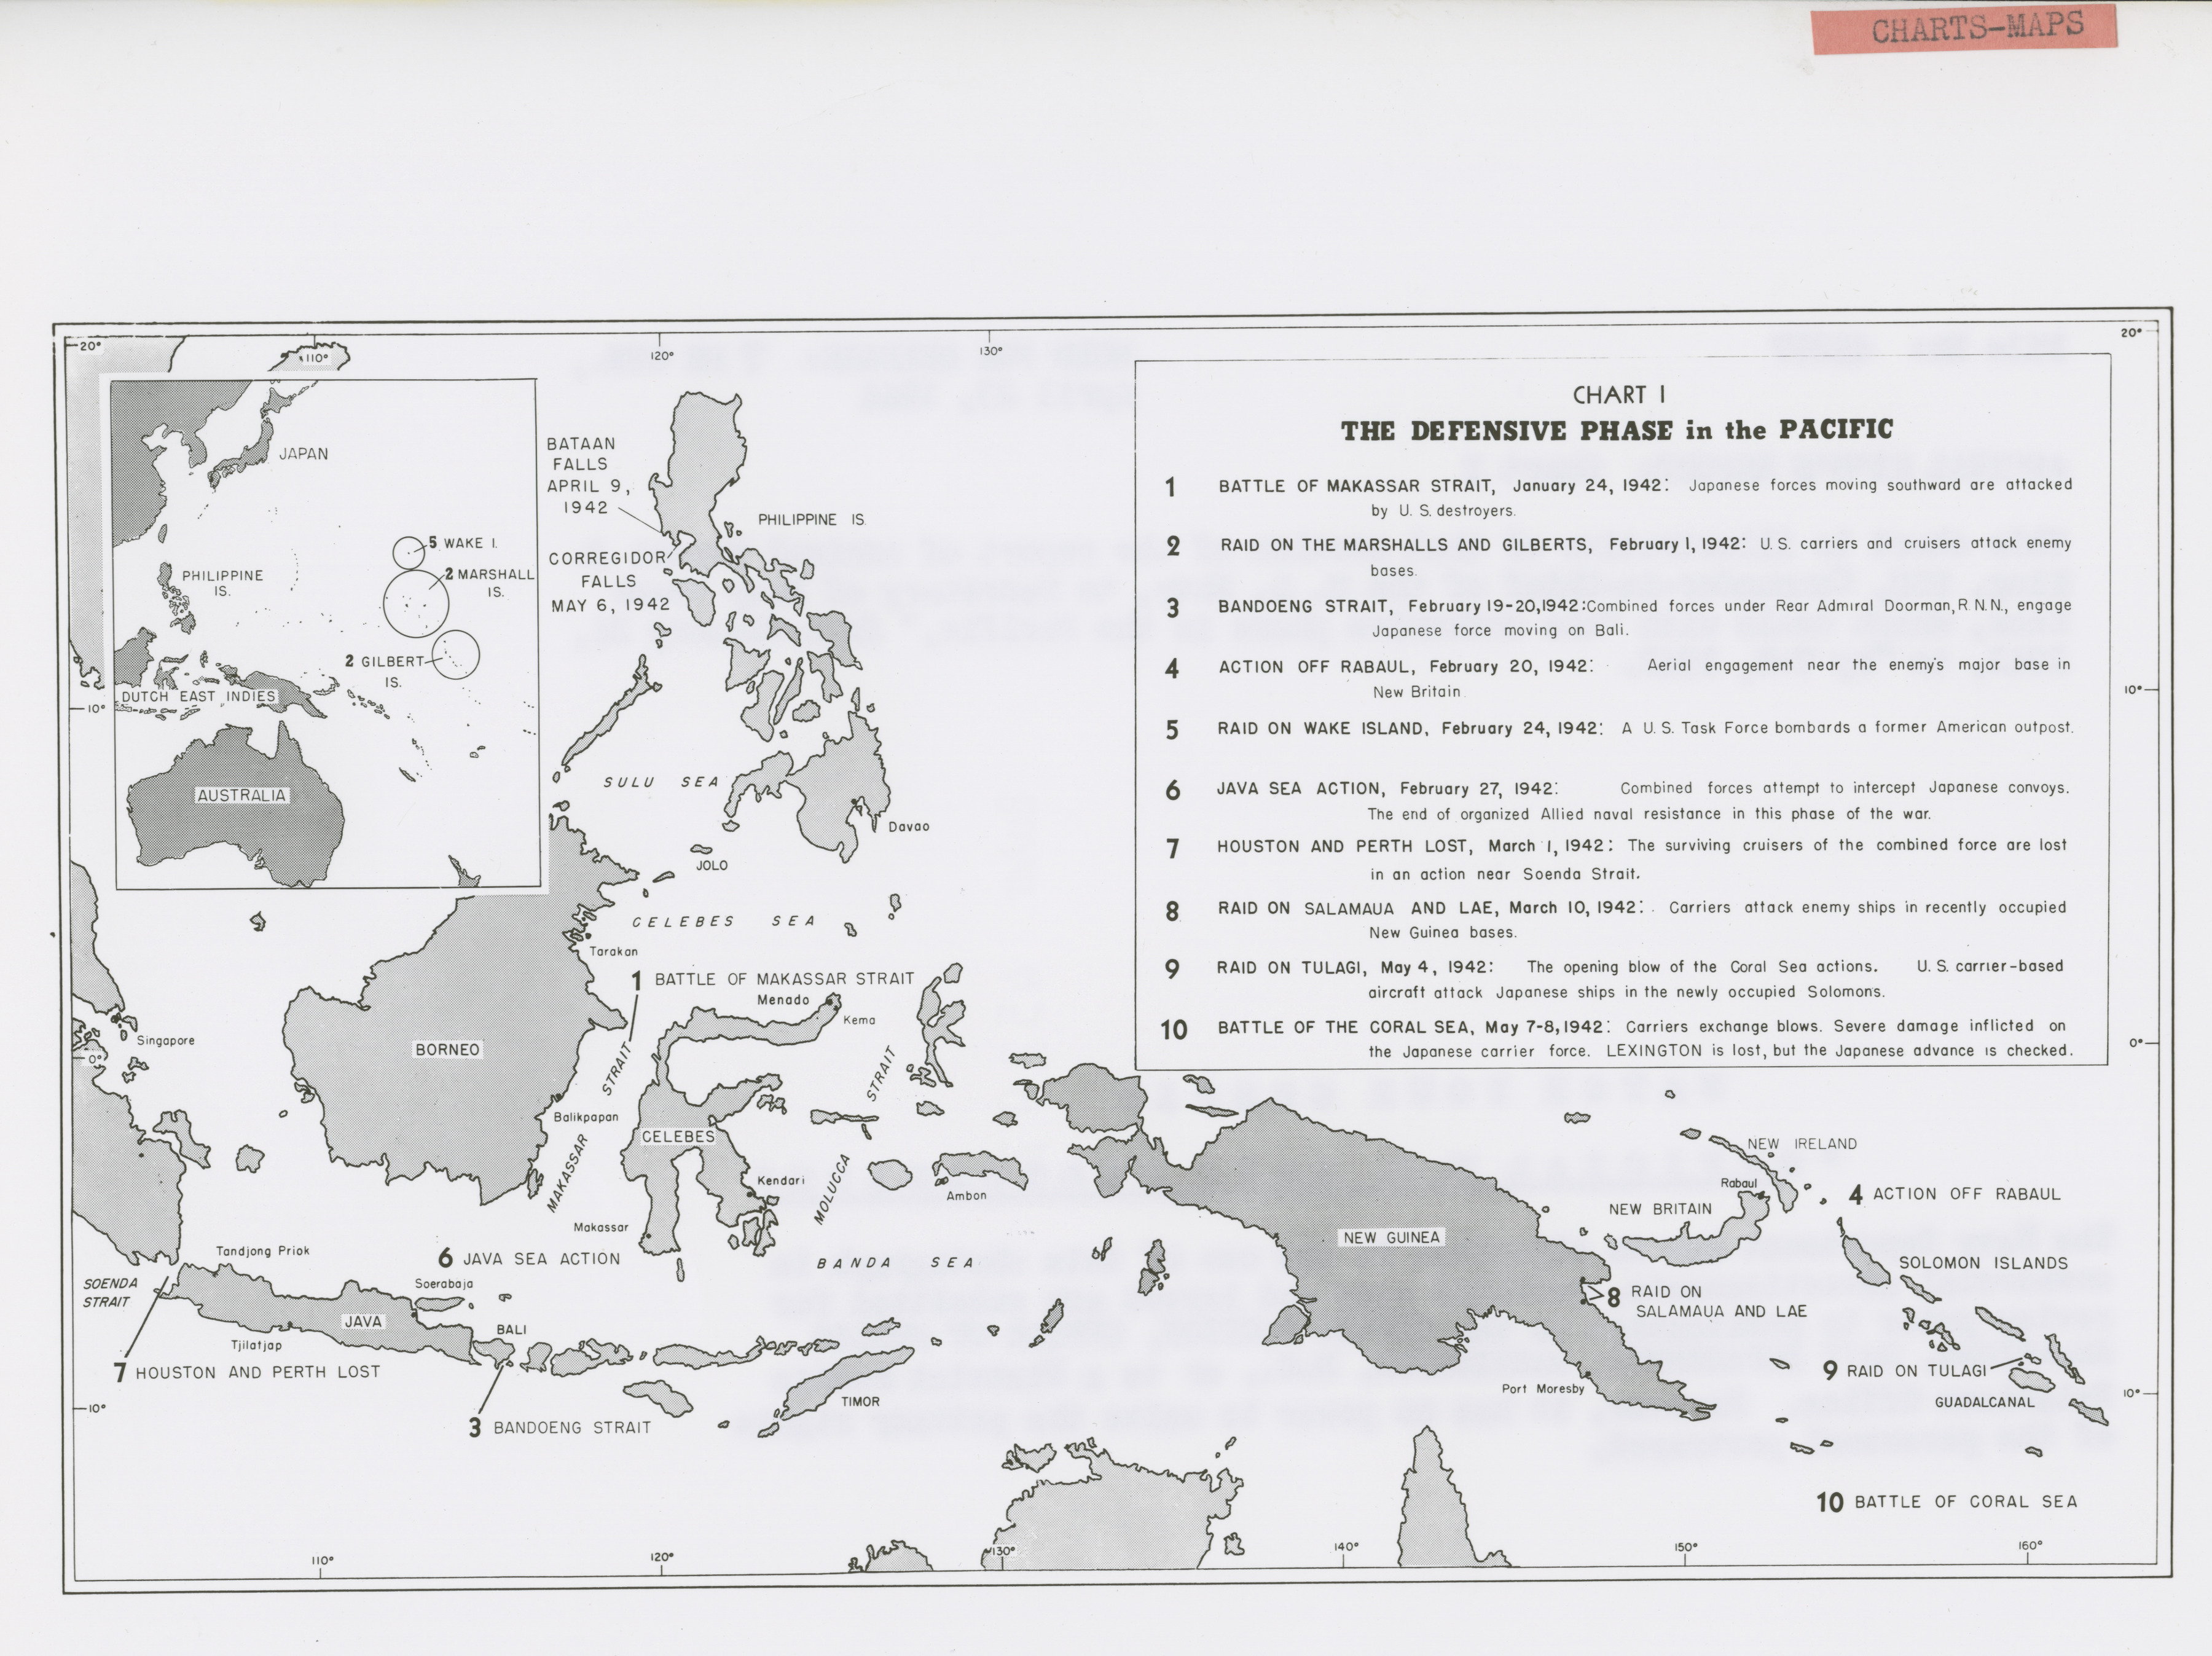
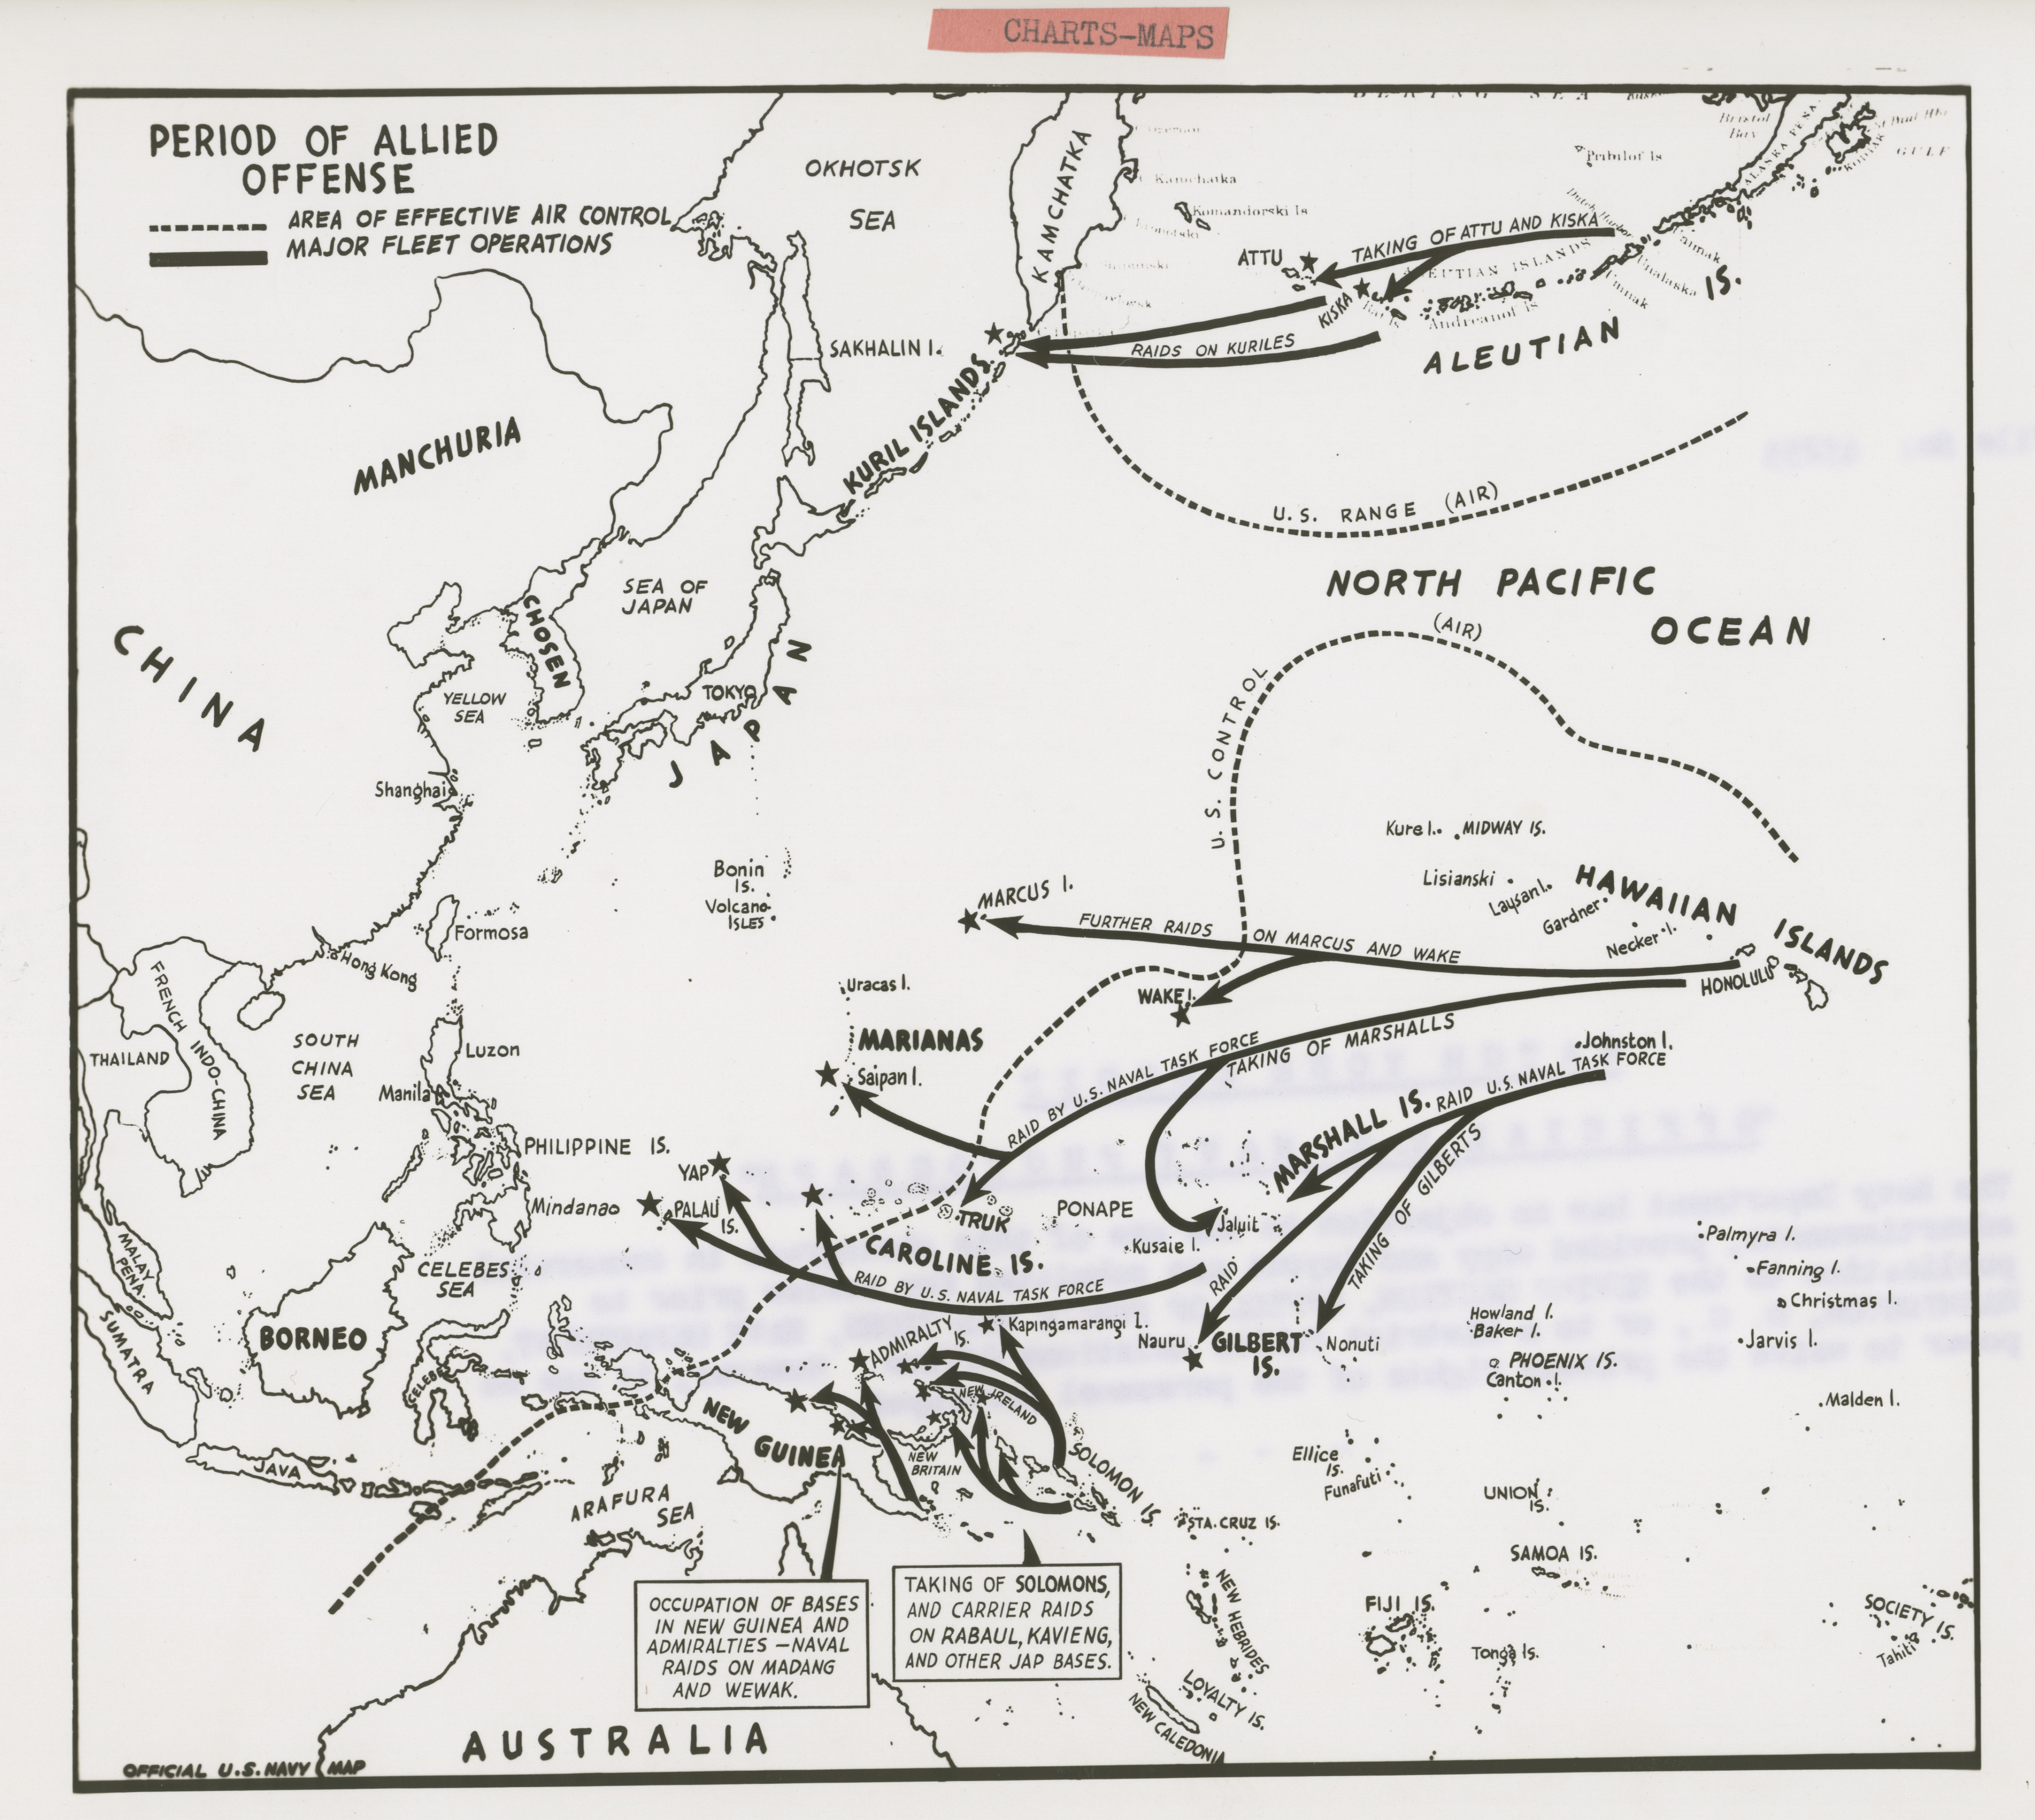
Defensive phase in the Pacific from January 1942 to May 1942 in a report from April 1944
444.Photograph. Official U. S. Navy Map of Western Pacific 'File No: 45297 April 23, 1944 Admiral King's Report: Chart...
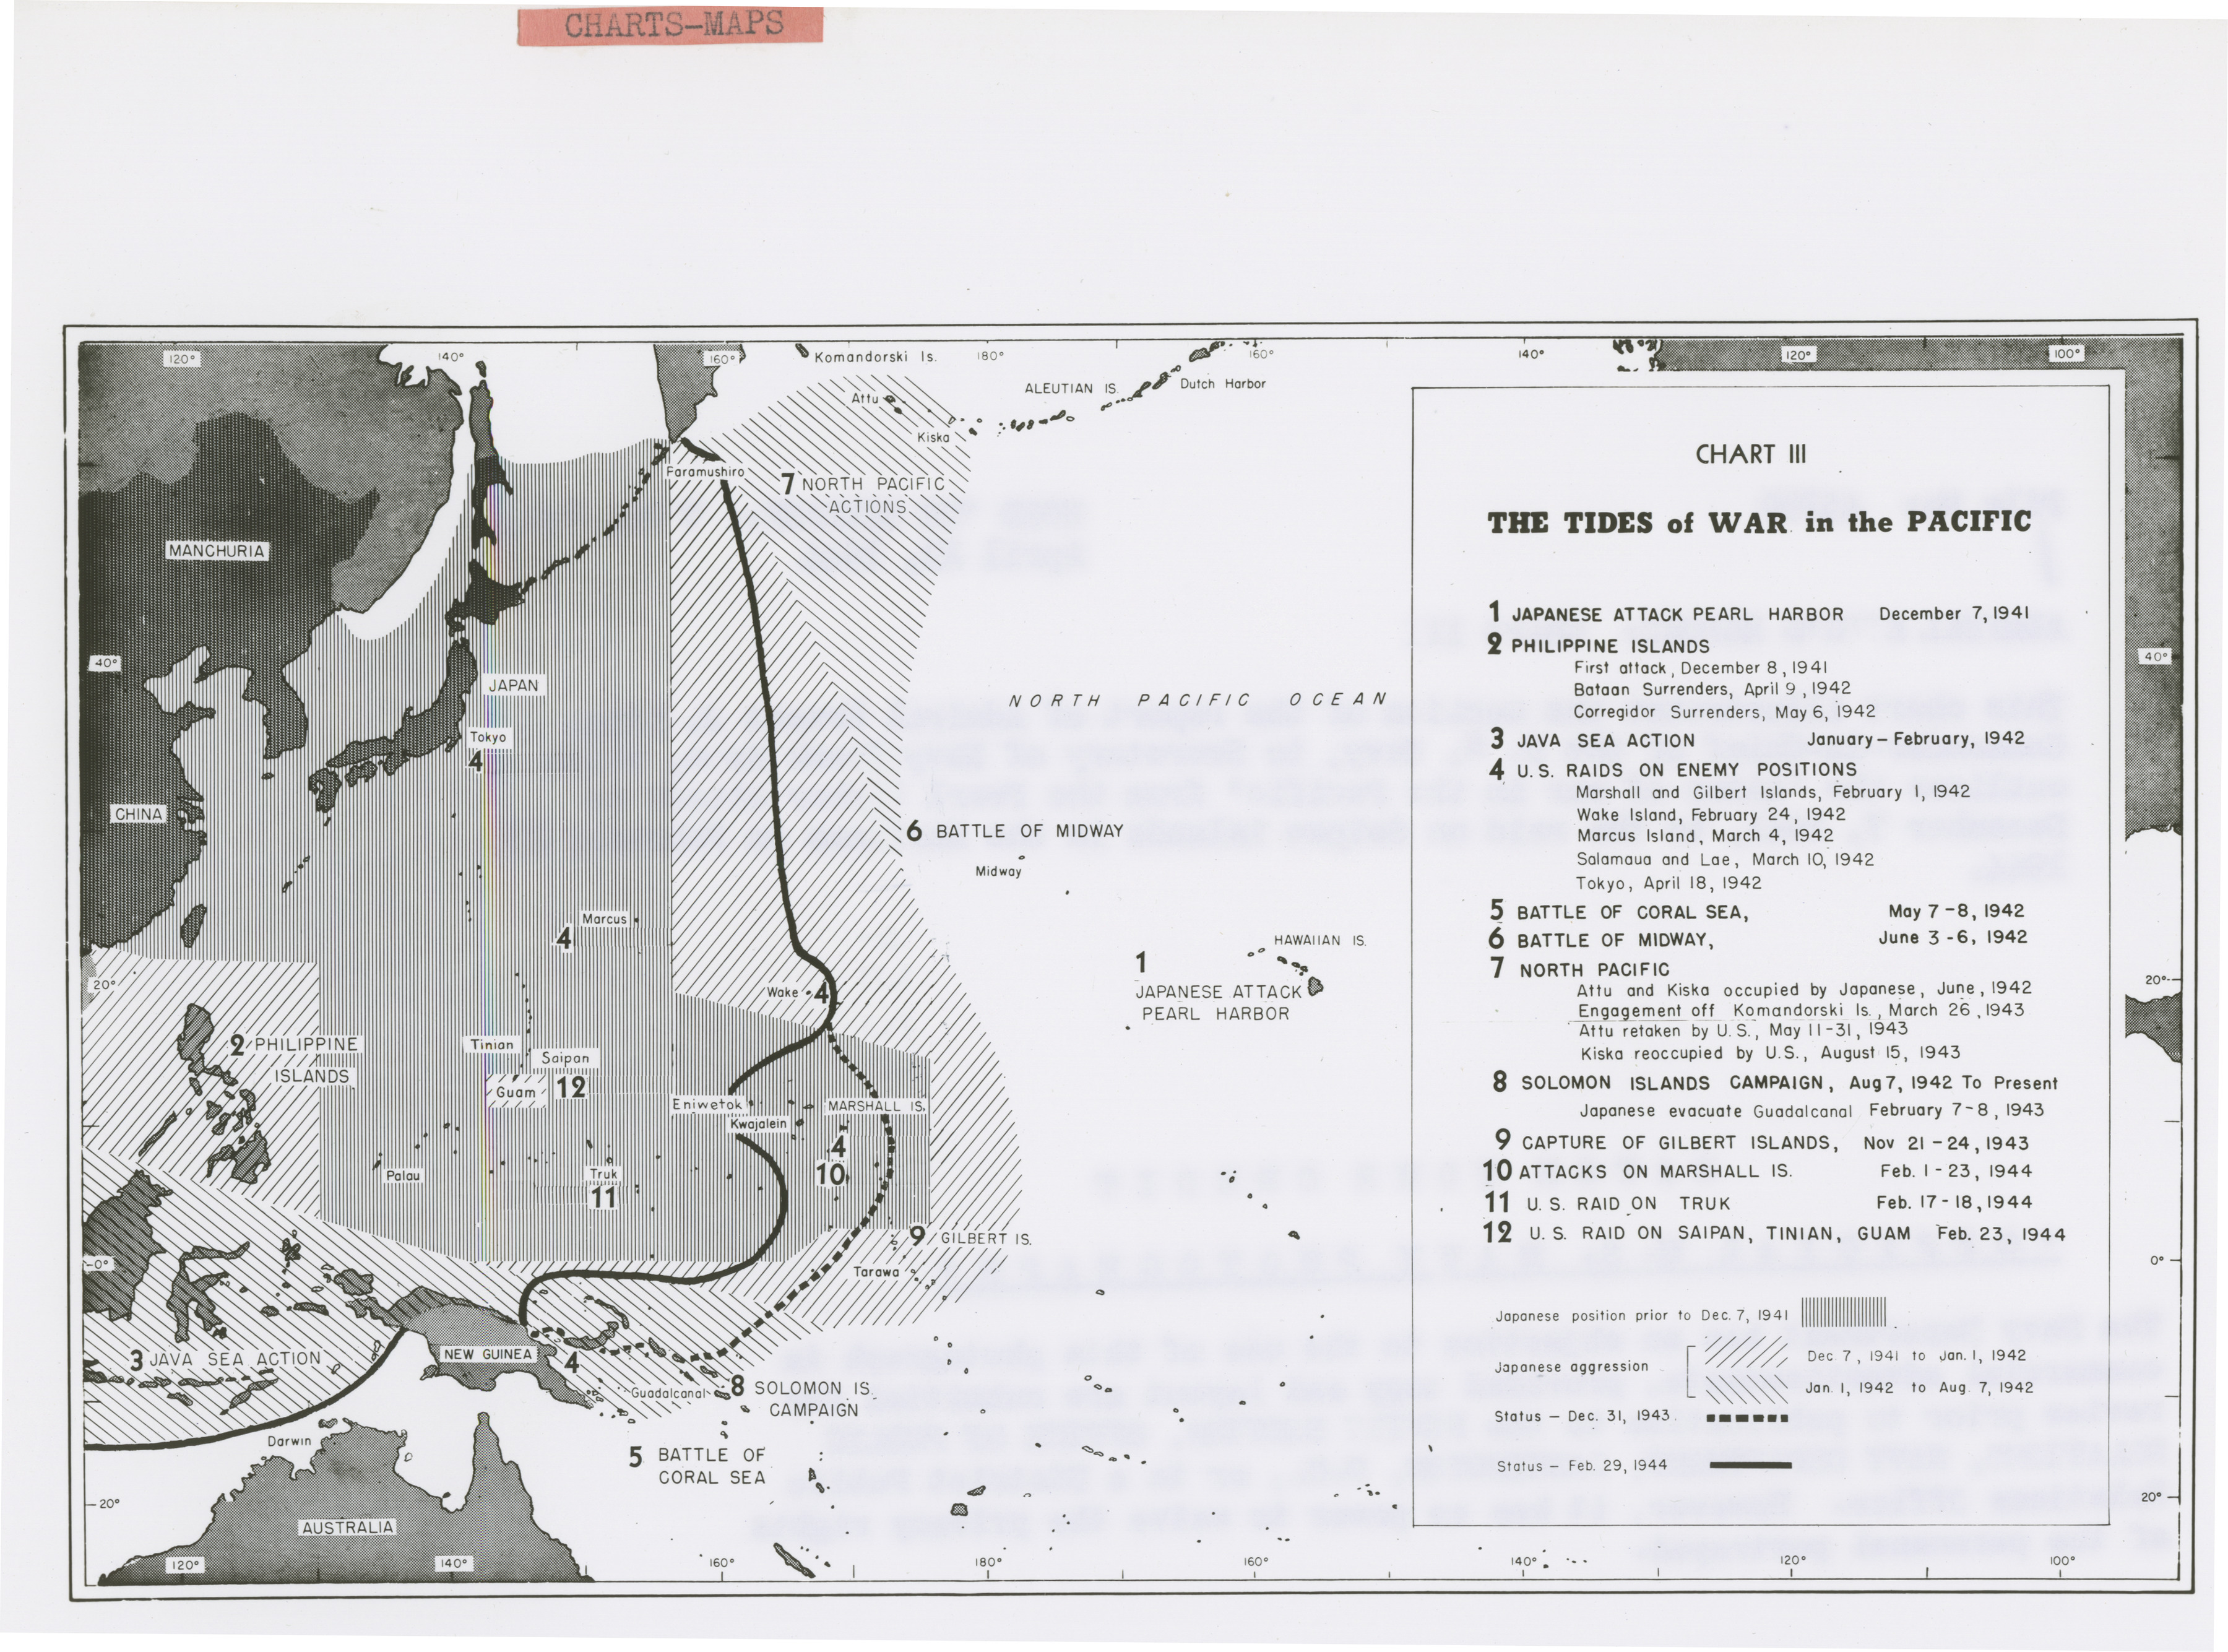
This chart illustrates tides of war in the Pacific from the Pearl Harbor attack on December 7, 1941, to the raid on Saipan Islands in the Marianas on February 23, 1944
446.Photograph. Official U. S. Navy Map of Western Pacific 'File No: 45299 April 23, 1944 Admiral King's Report: Chart...
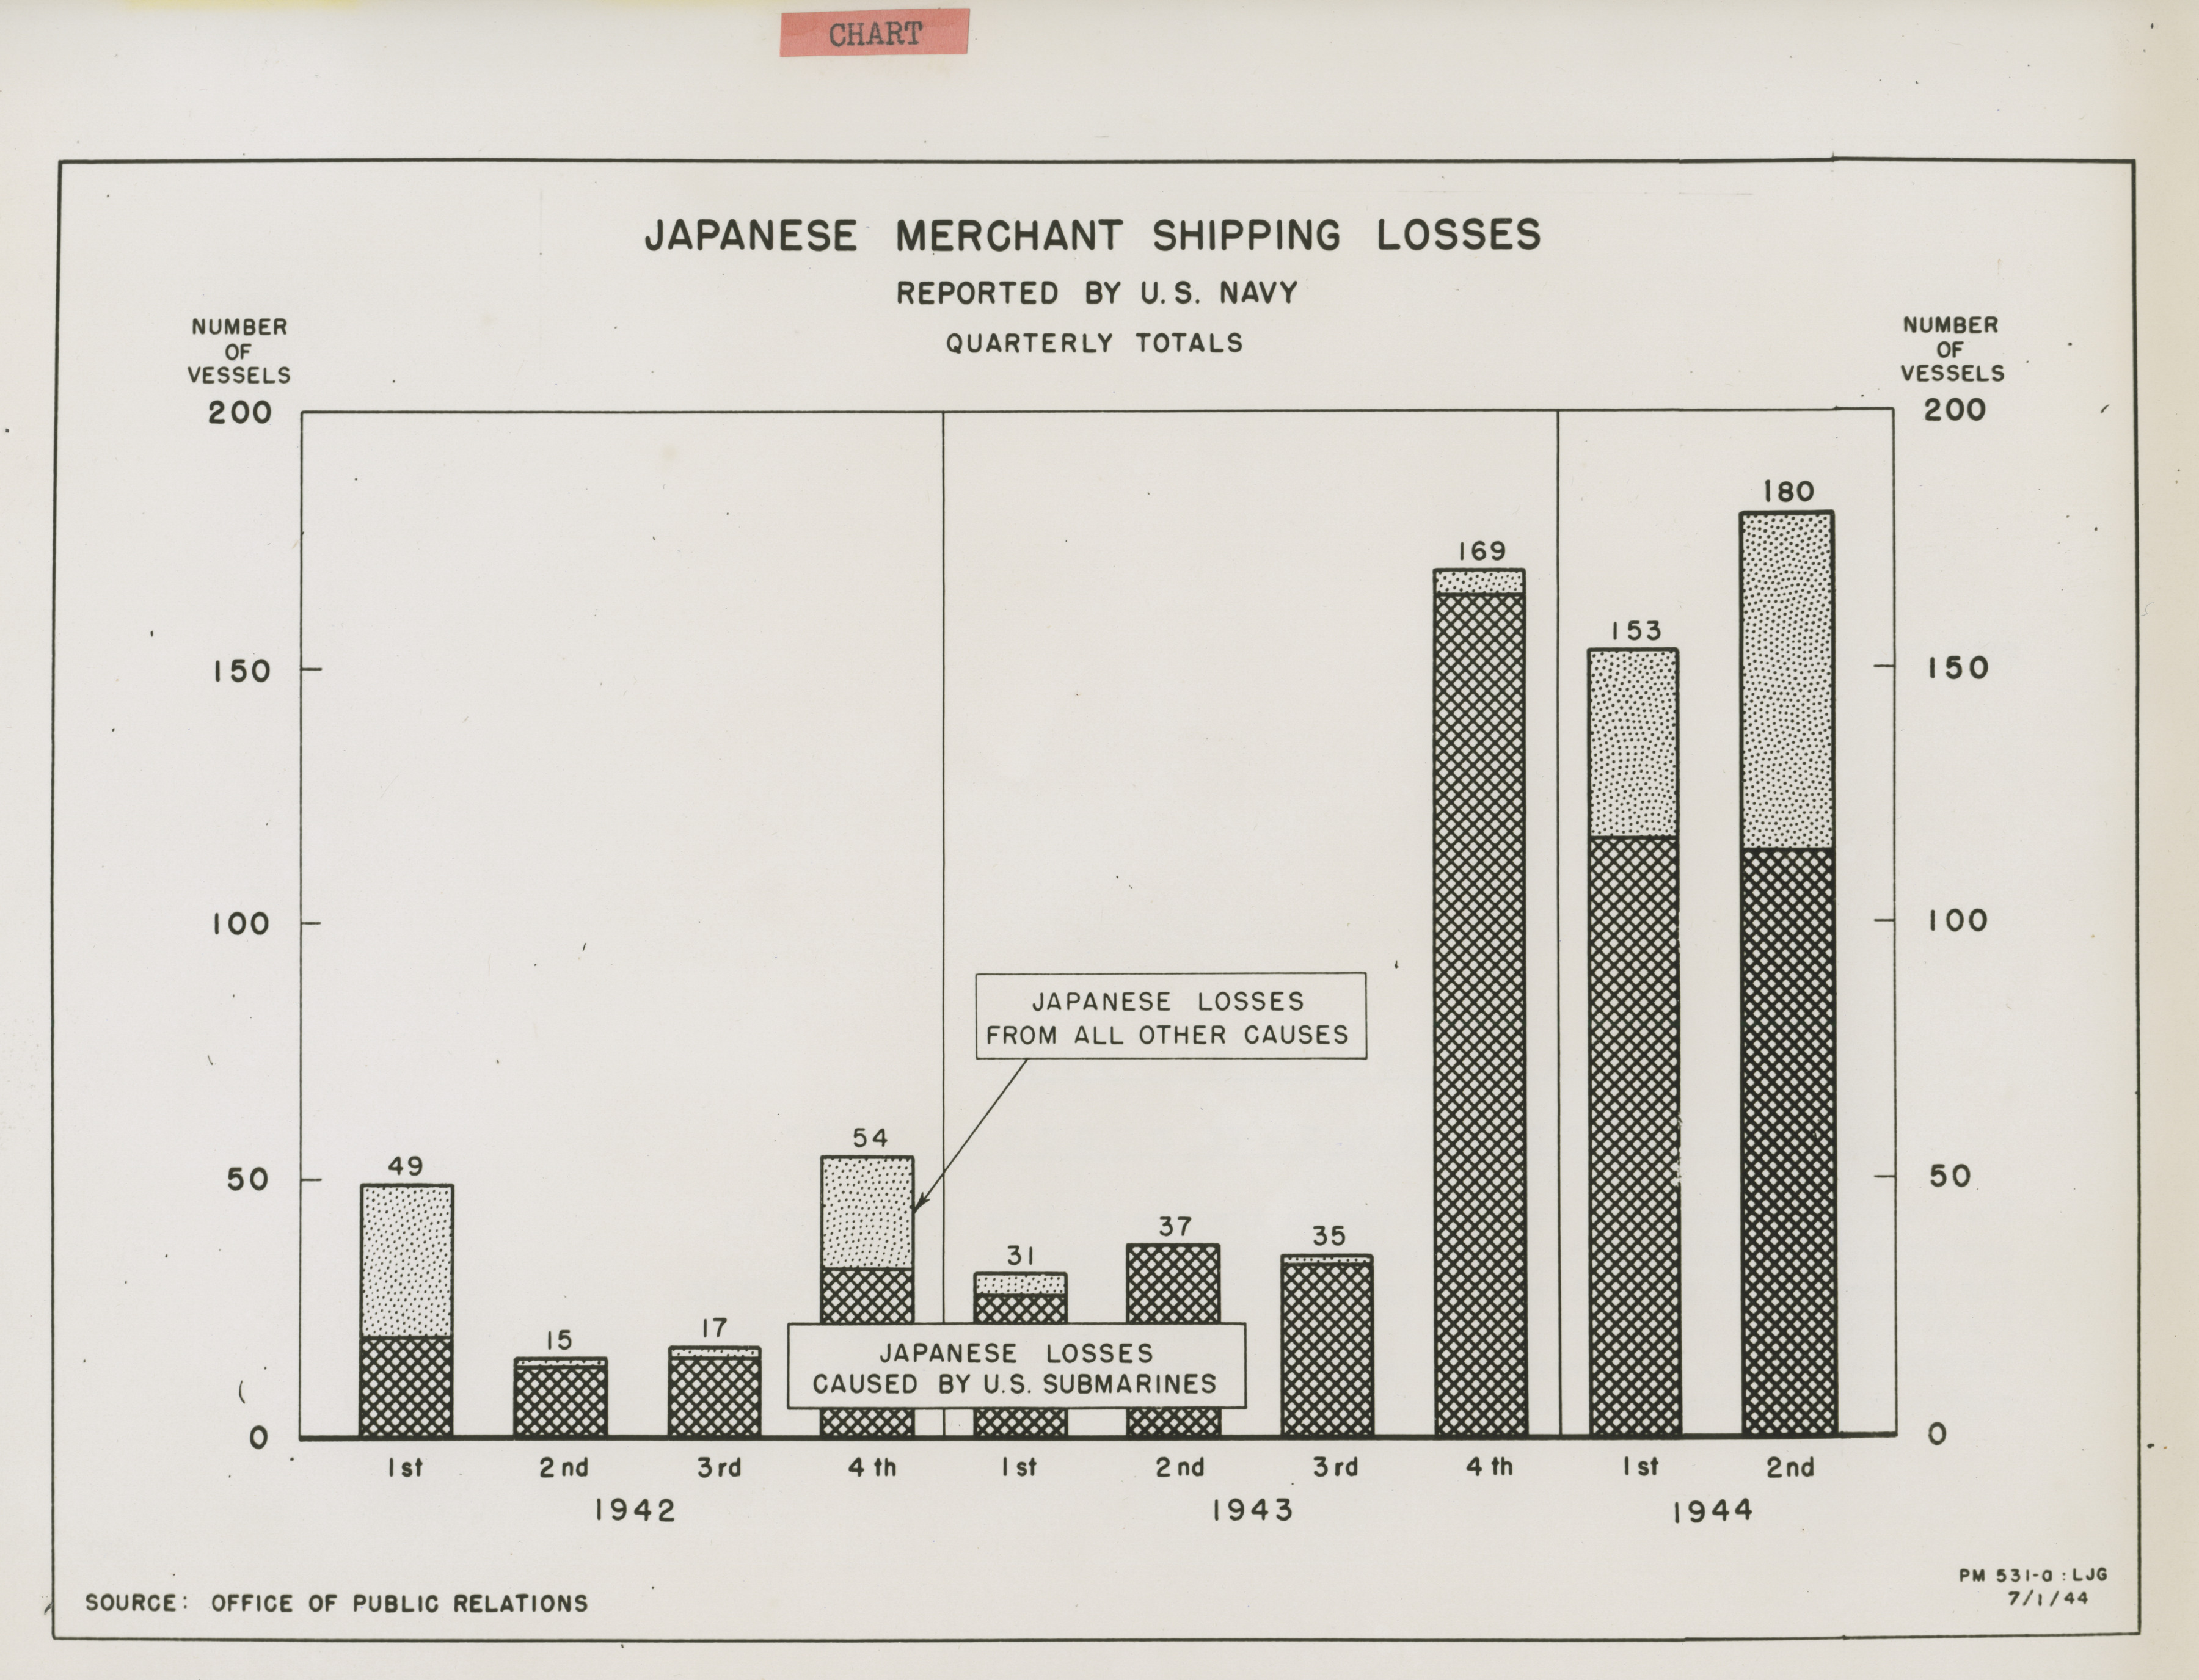
Japanese Merchant Shipping Losses Quarterly Totals 1942 1944 presented in July 1944
448.Photograph. Official U. S. Navy Chart 'File No: 45911 Japanese Merchant Shipping Losses Quarterly Totals 1942 1944...
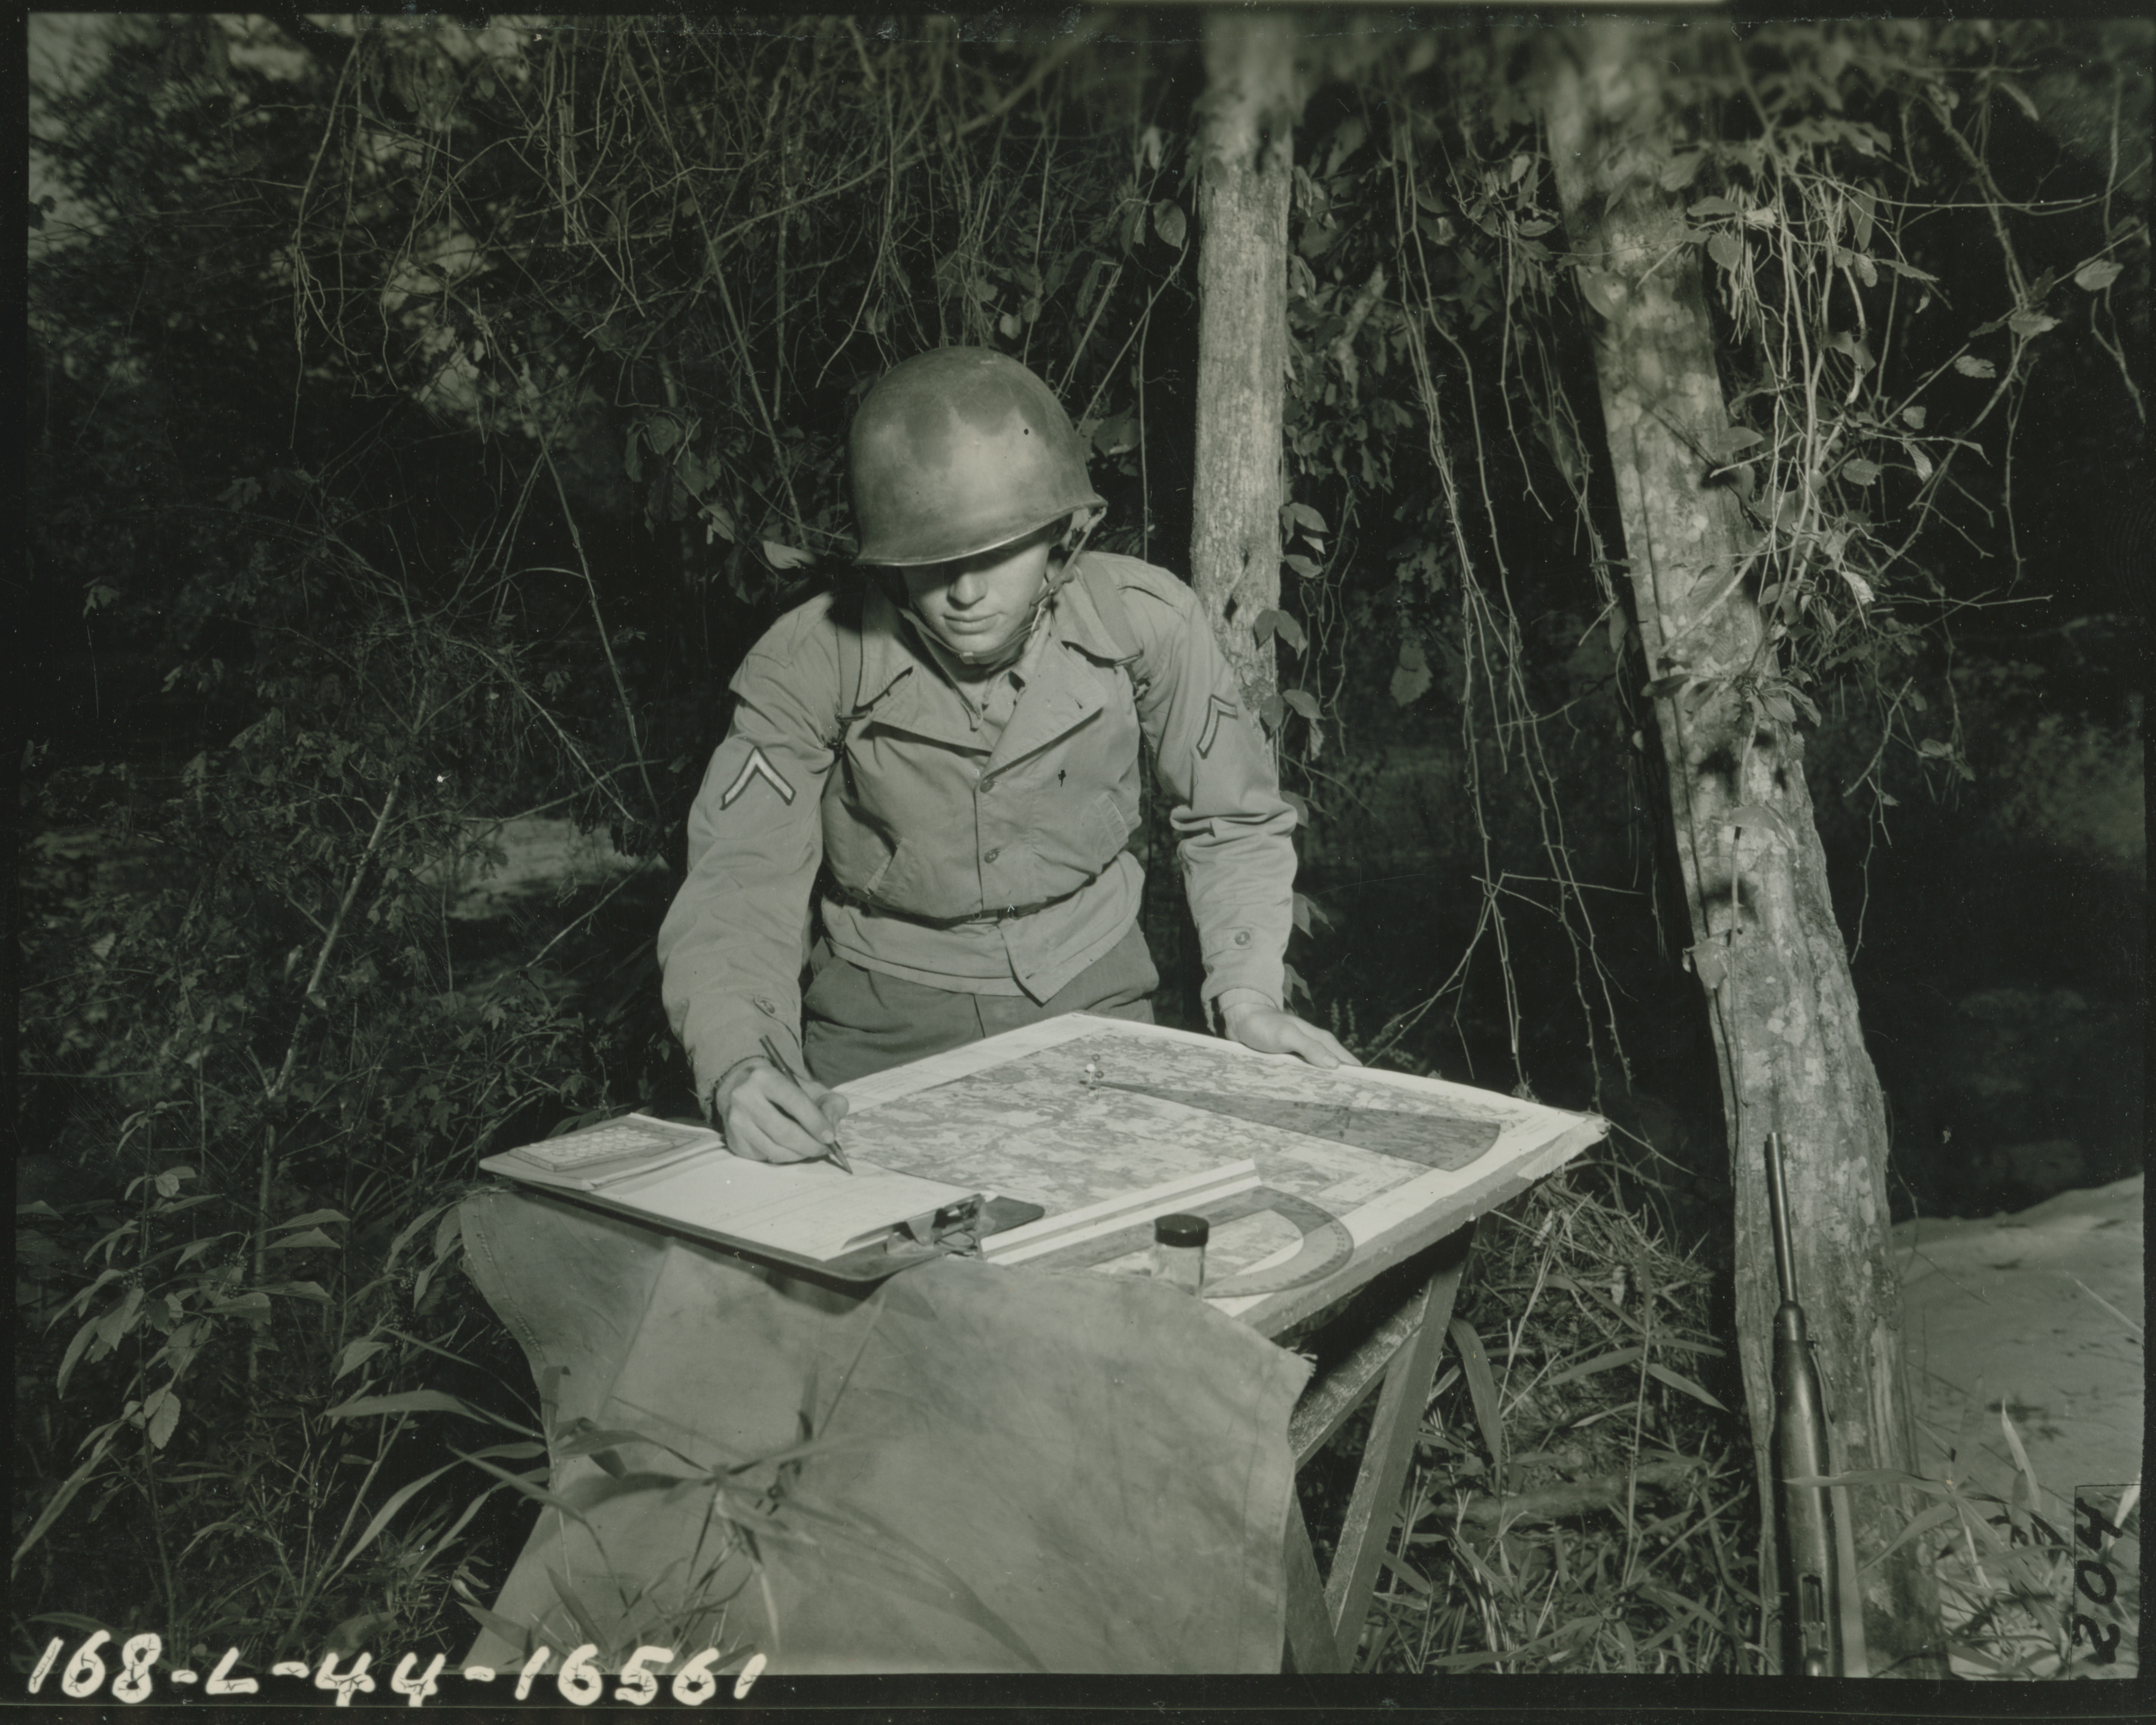
A soldier from the 607th Field Artillery Battalion with a firing chart at Fort Benning on 12 October 1944
1777. '12 Oct 44. Paik. Firing chart at fire direction center of B Battery, 607 FA Bn, 71st Div, Fort Benning, Ga. 168-...
Official U. S. Navy Map of Western Pacific
Official U. S. Navy Map of Western Pacific 'Pacific Pearl Harbor to China 'File No: 45255 Period of Allied Offense' No...
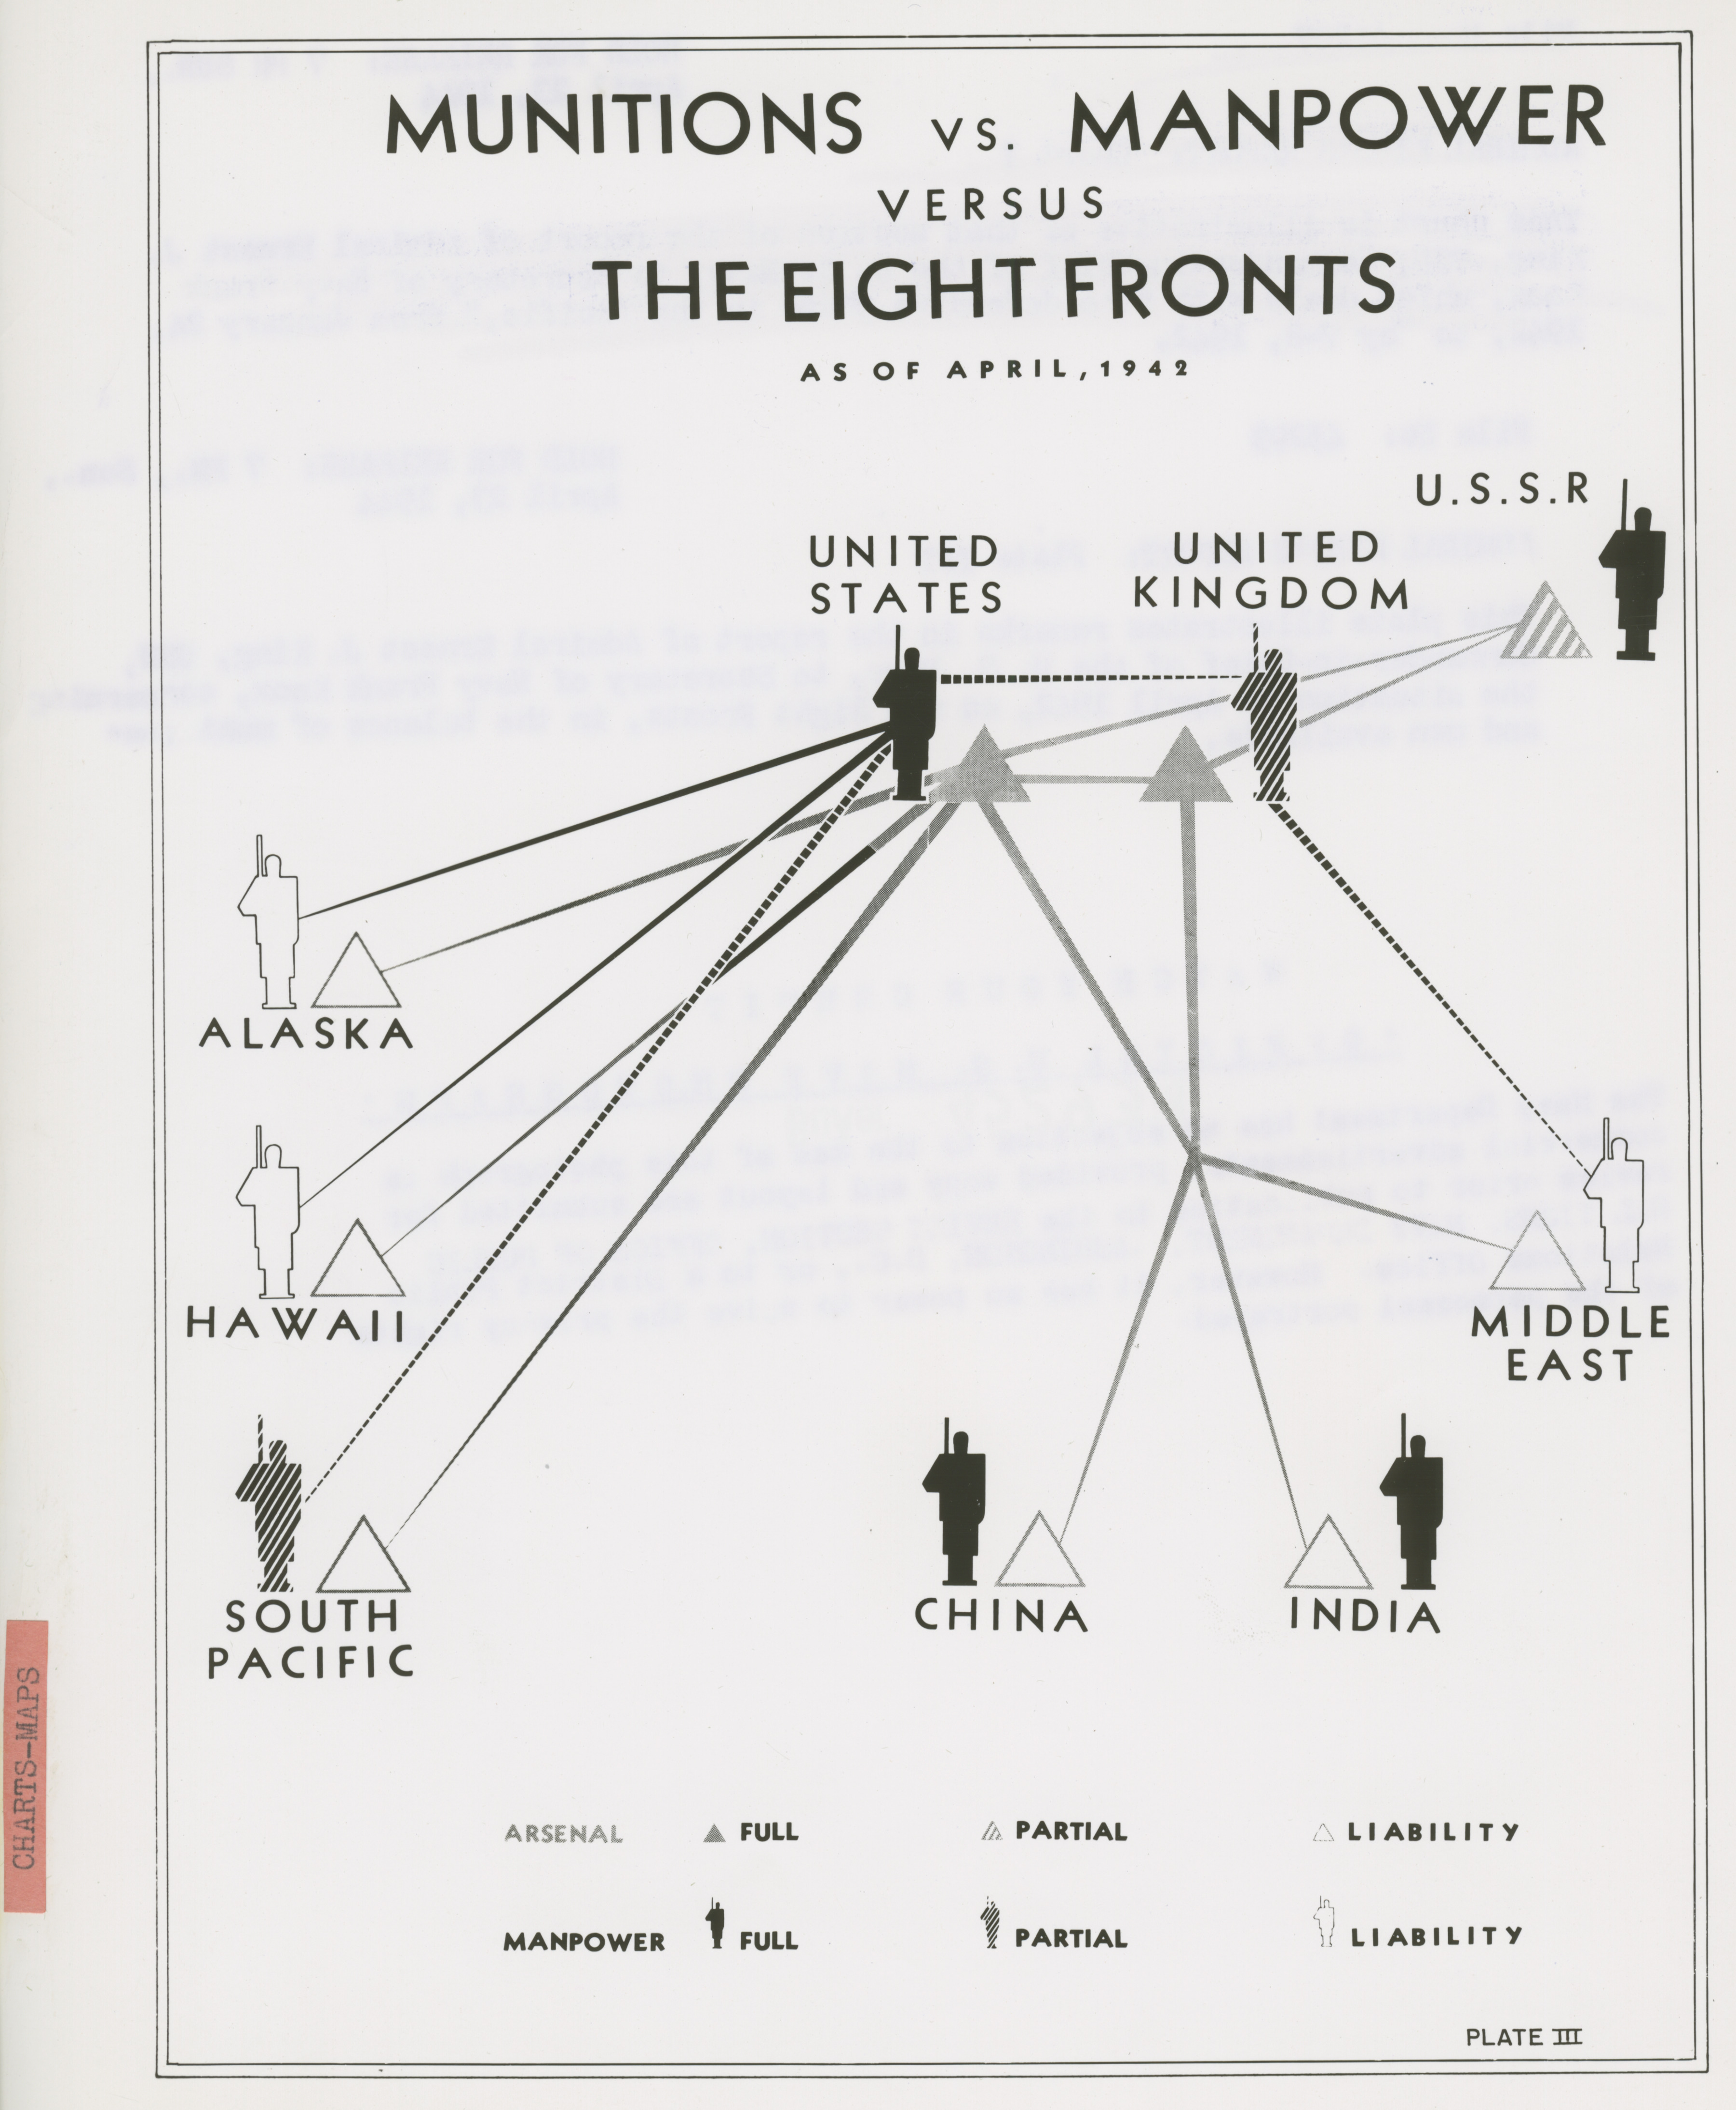
The situation in April 1942, on the Eight Fronts, in the balance of munitions and men available
440.Photograph. Official U. S. Navy Chart 'File No: 45293 April 23, 1944 Admiral King's Report: Plate III This plate...
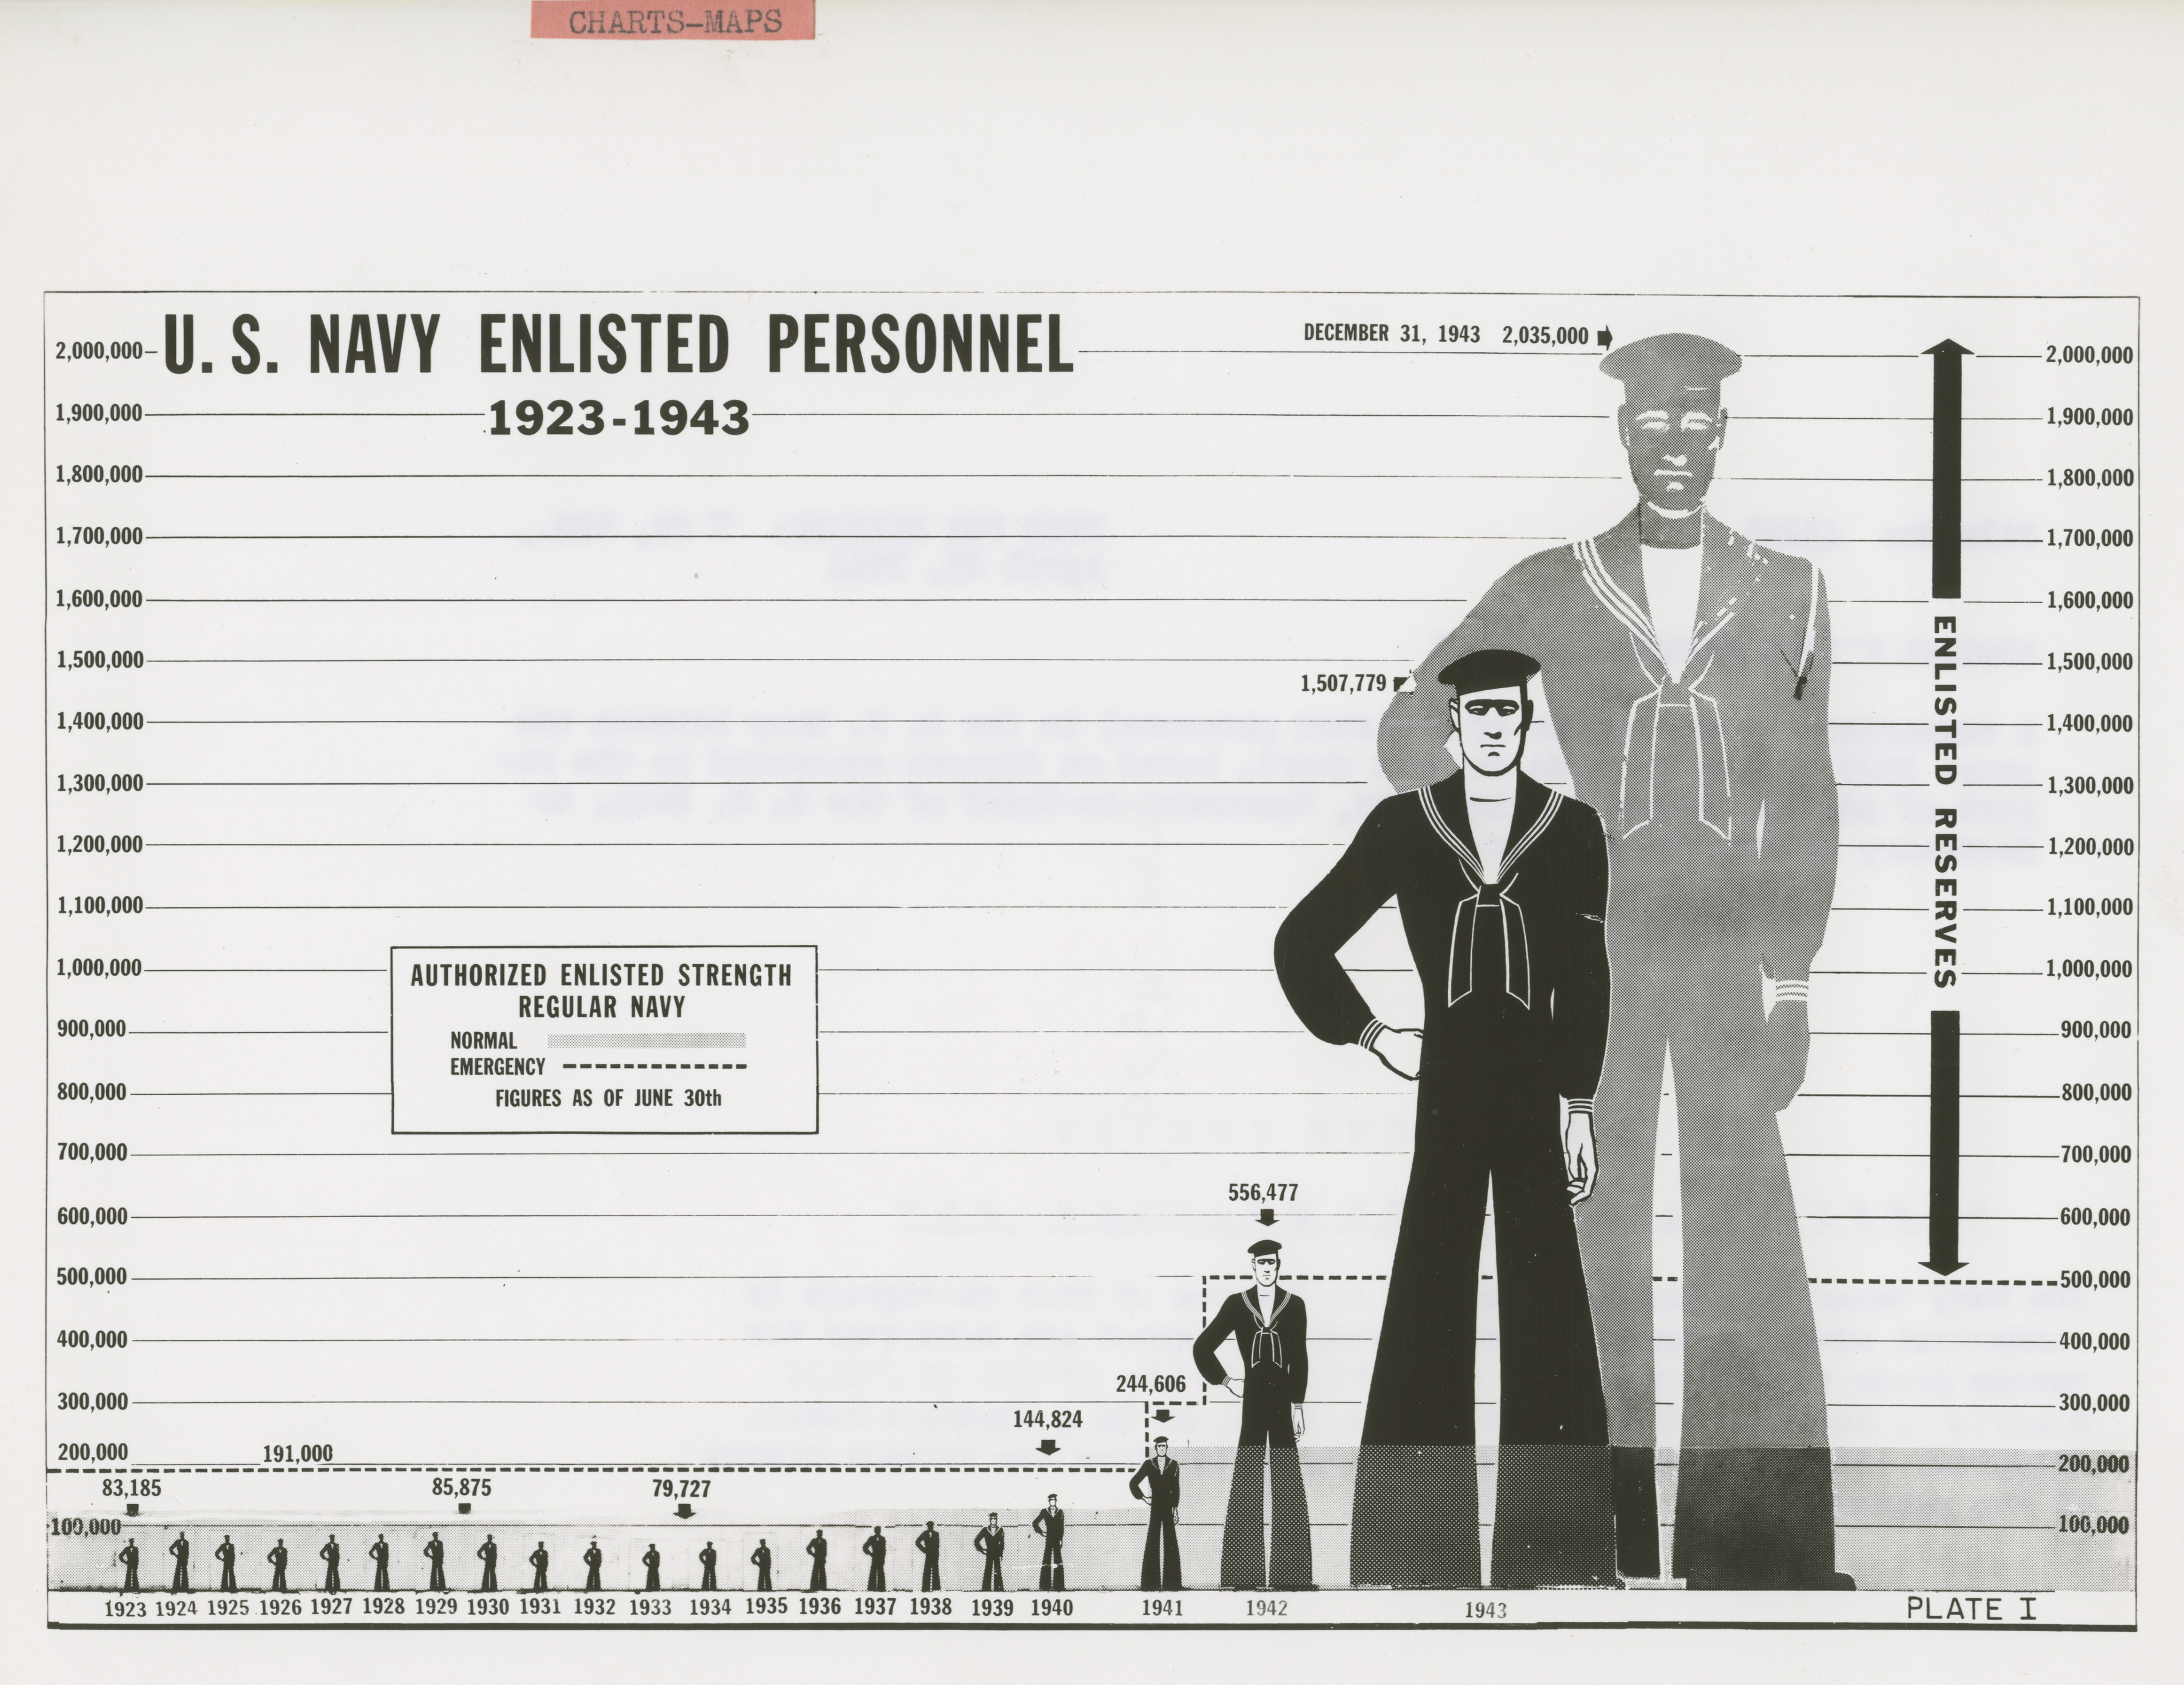
A Comparison in the amount of enlisted personnel in the U.S. Navy between the years 1923 to 1943
Official U. S. Navy Chart 'File No: 45291 April 23, 1944 Admiral King's Report: Plate I A Comparison in the amount of...
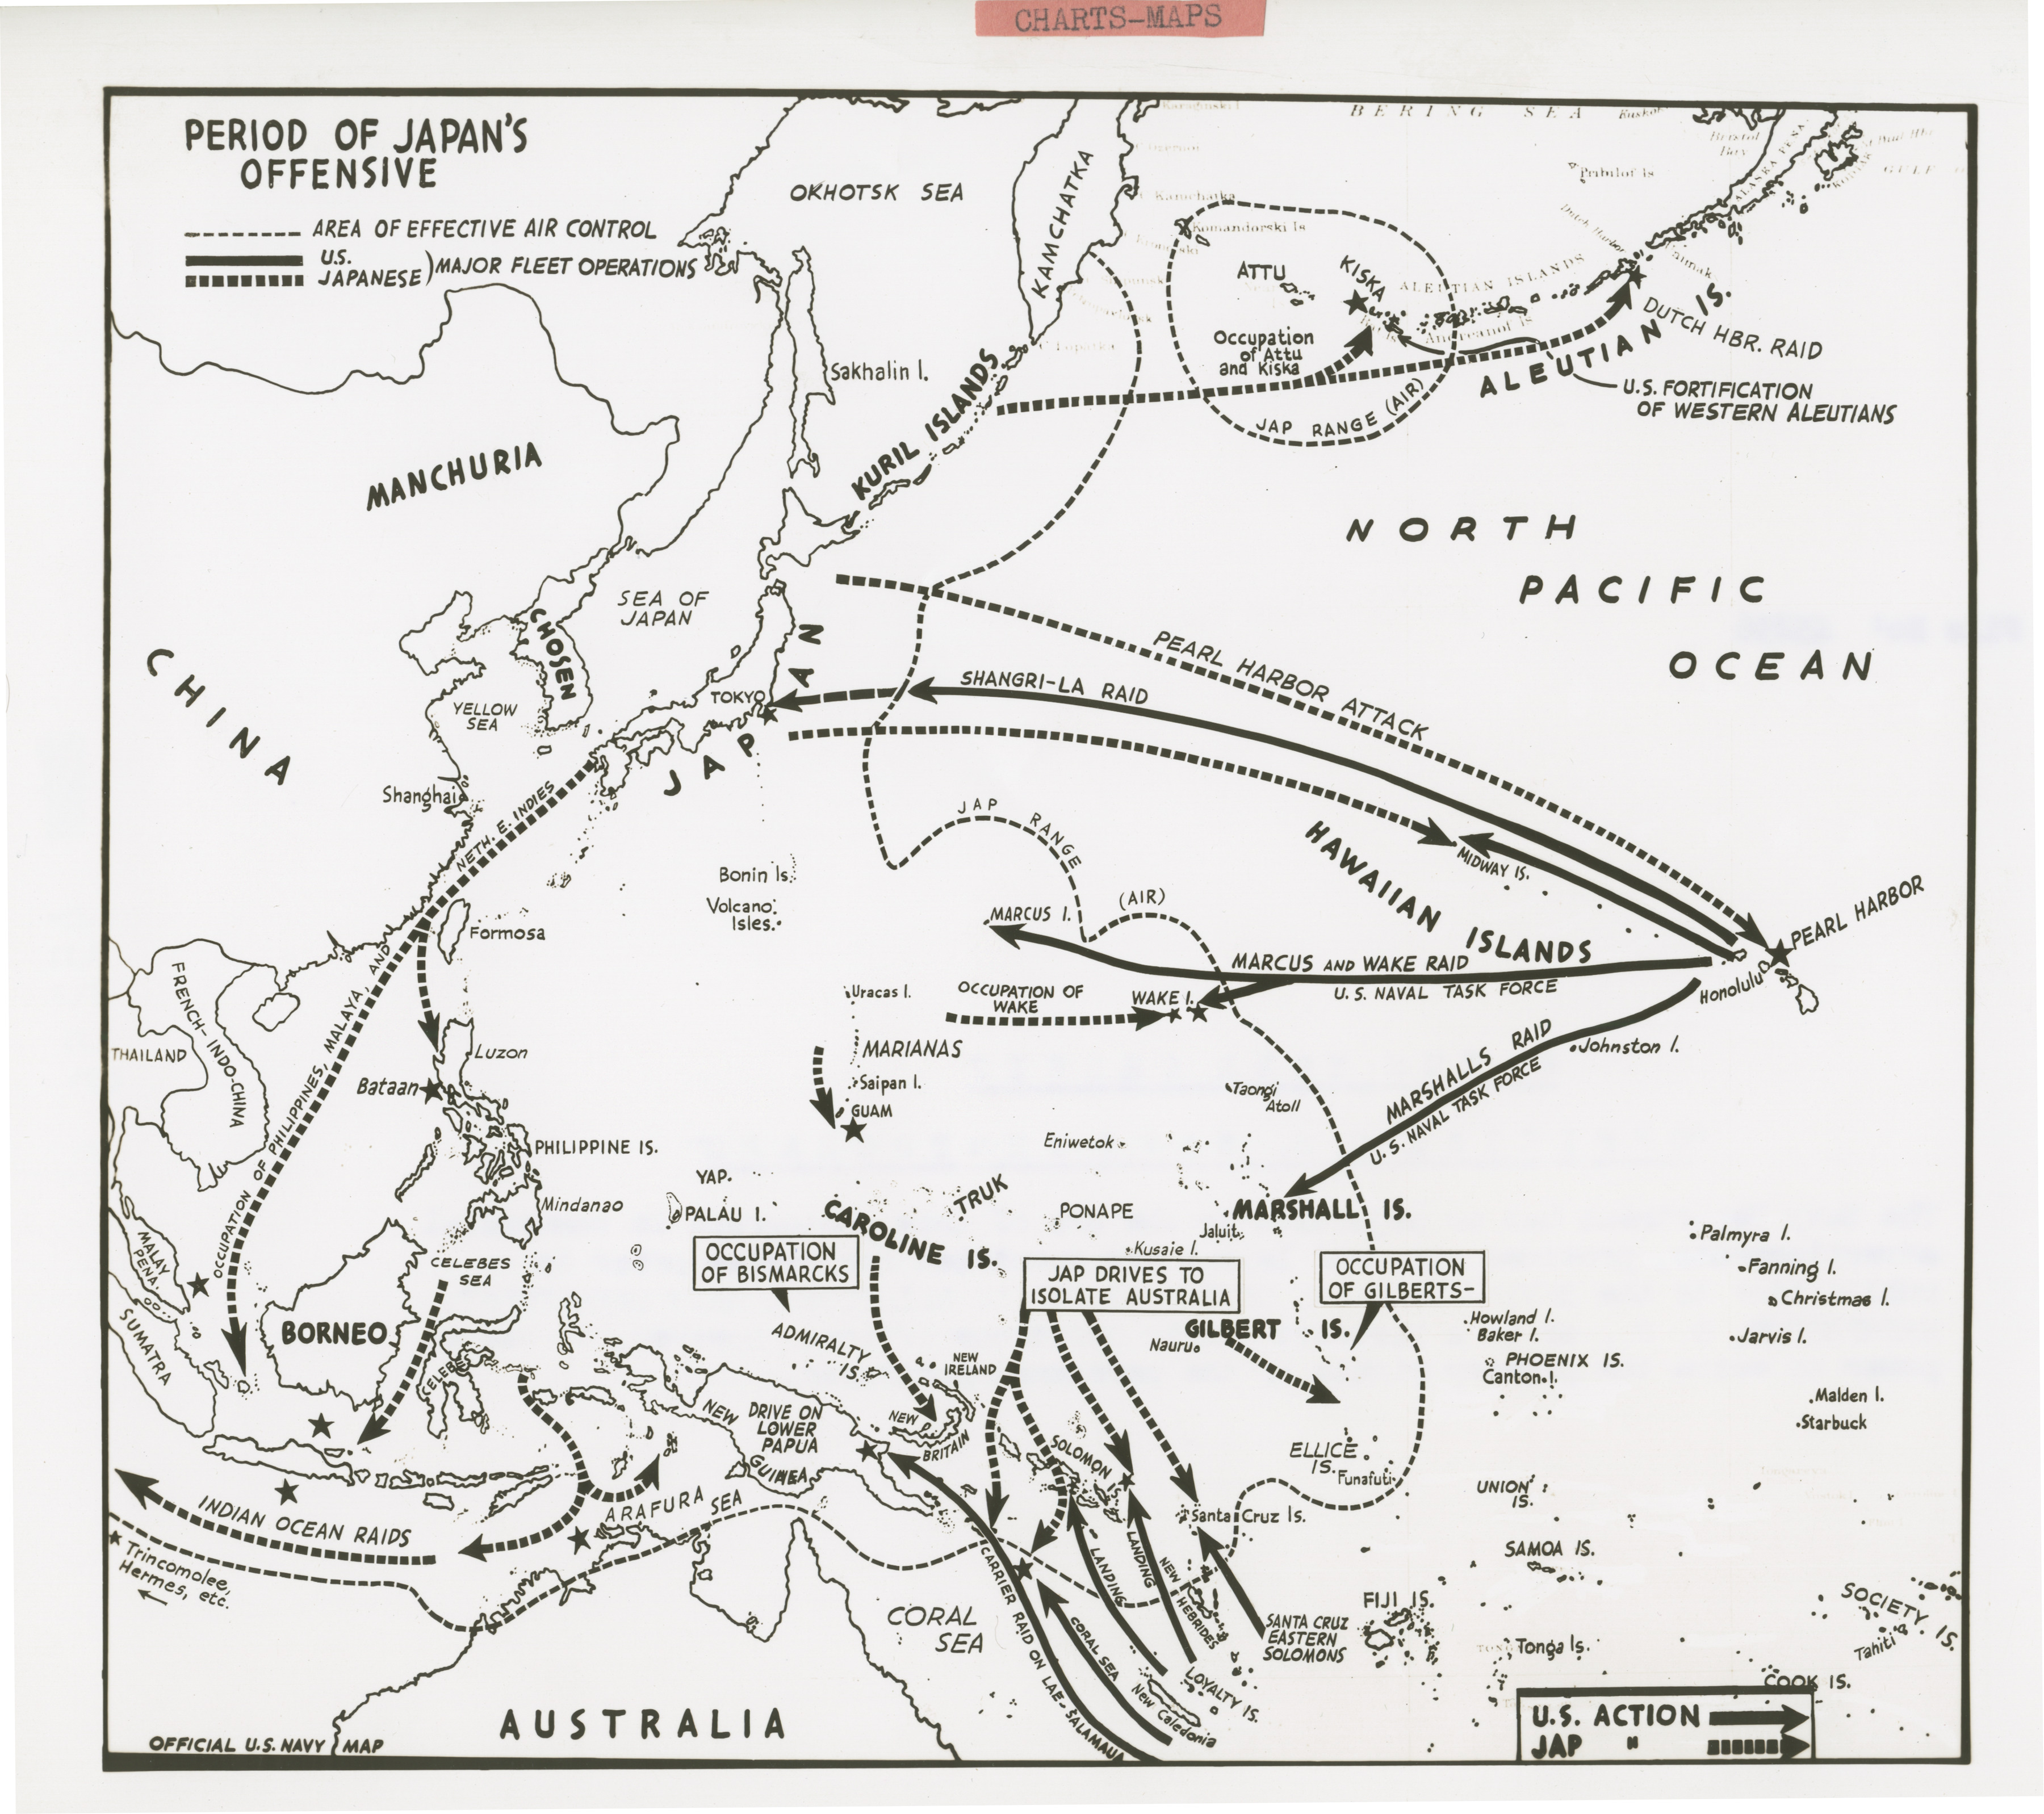
Official U. S. Navy Map of Western Pacific Pearl Harbor to China
Official U. S. Navy Map of Western Pacific Pearl Harbor to China 'File No: 45256 Period of Japan's Offensive' No date
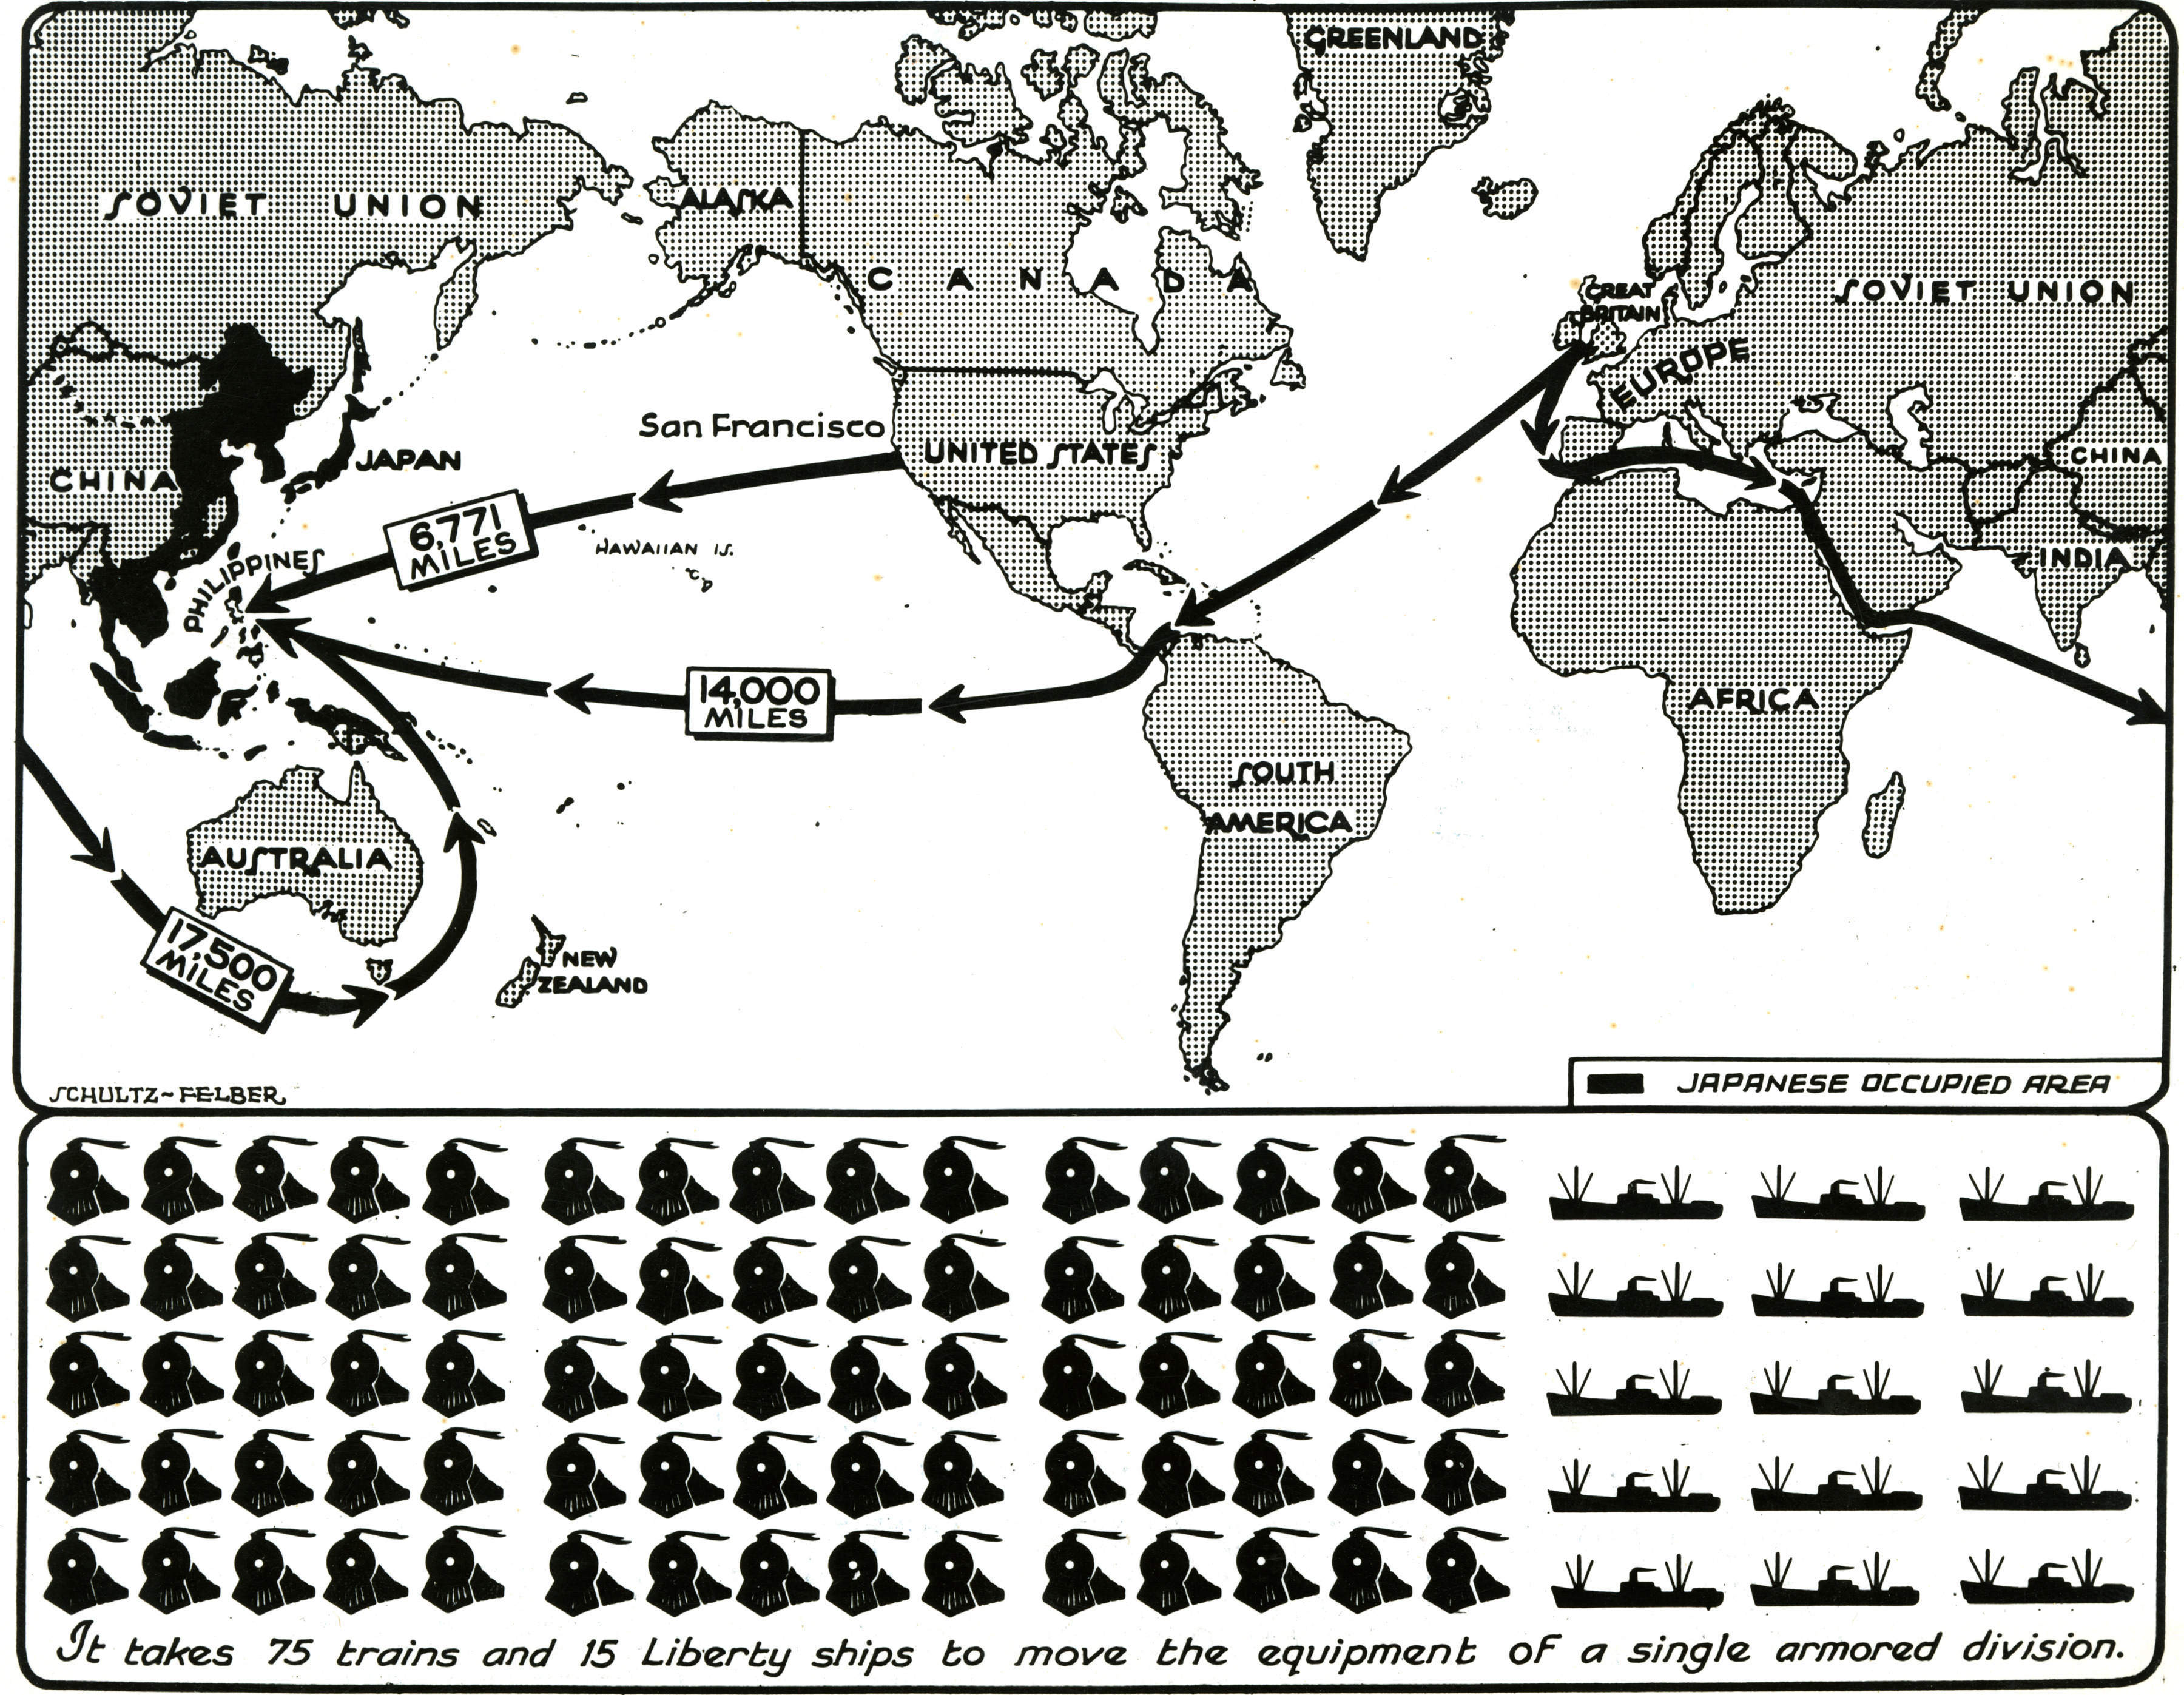
Chart/map showing distances and amounts of men and material moved into the Pacific Theater, 1945
Photograph. Chart/map showing the vast distances over which U.S. men and equipment were moved to the Pacific Theater of...
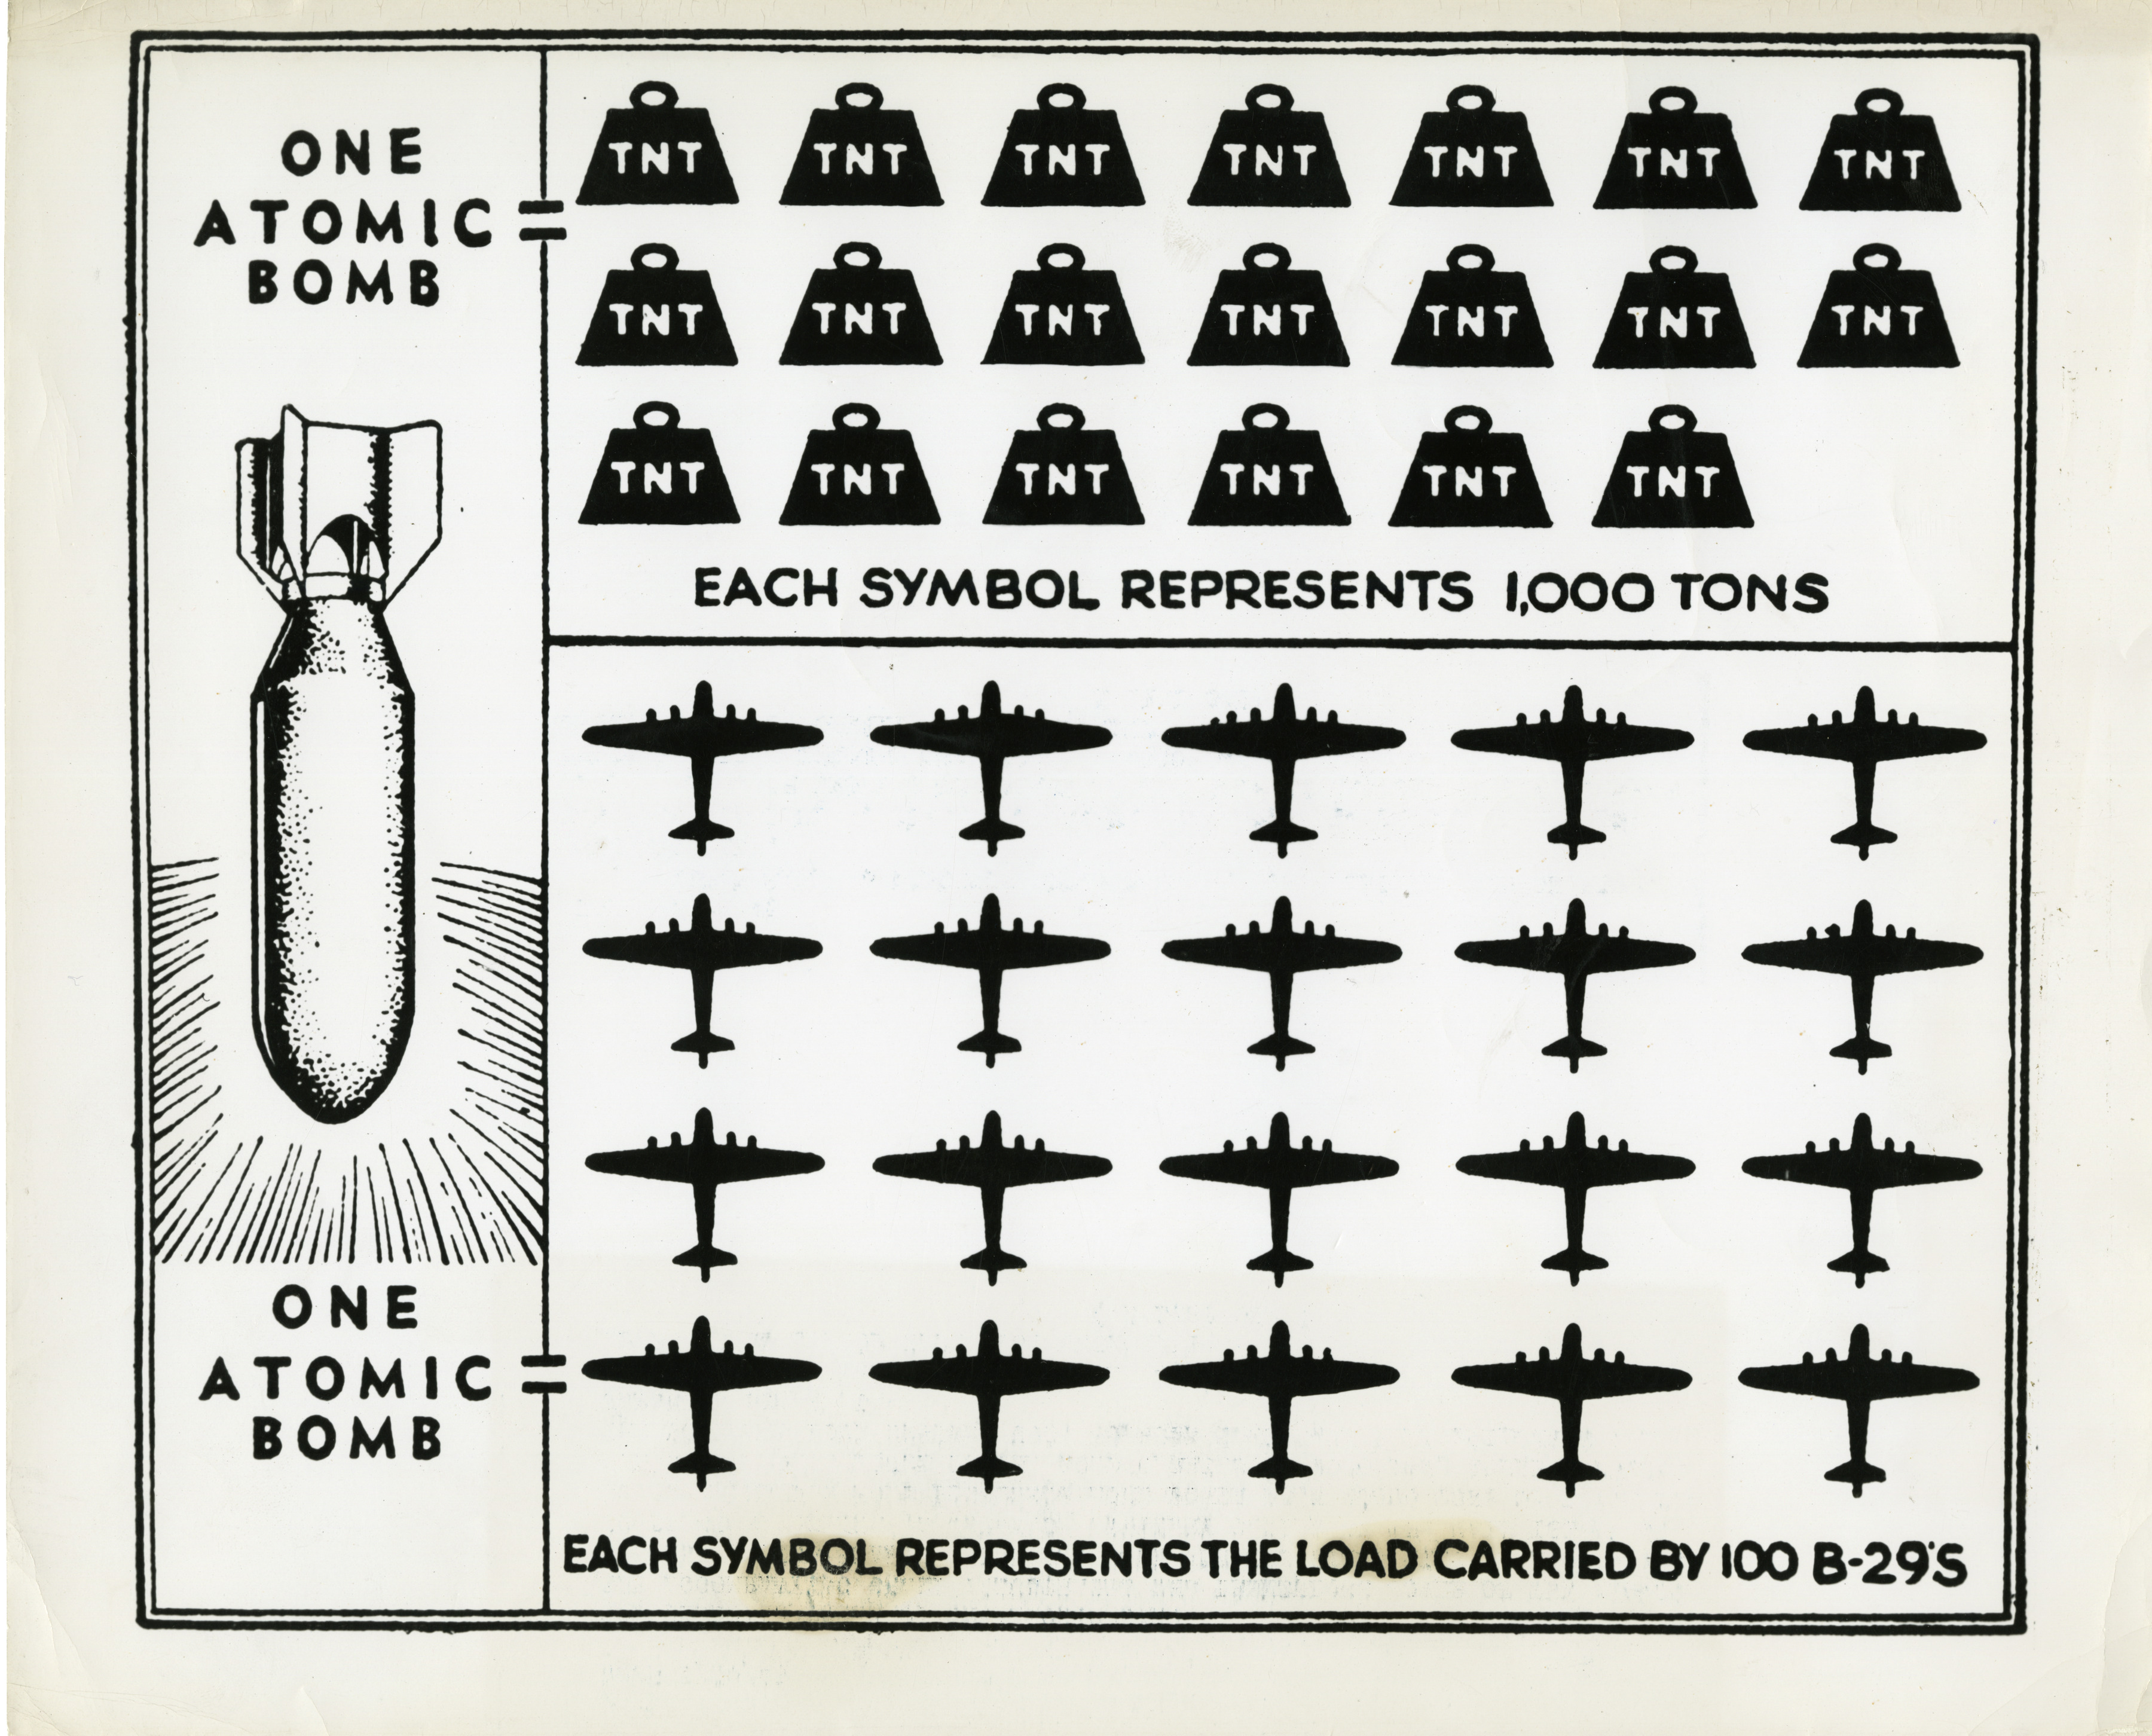
Pictogram showing the relative power of the atomic bomb, 1945
Photograph. Chart illustrating the relative power of the atomic bomb. Official Caption: "Rome 8/20/45. The blasting...
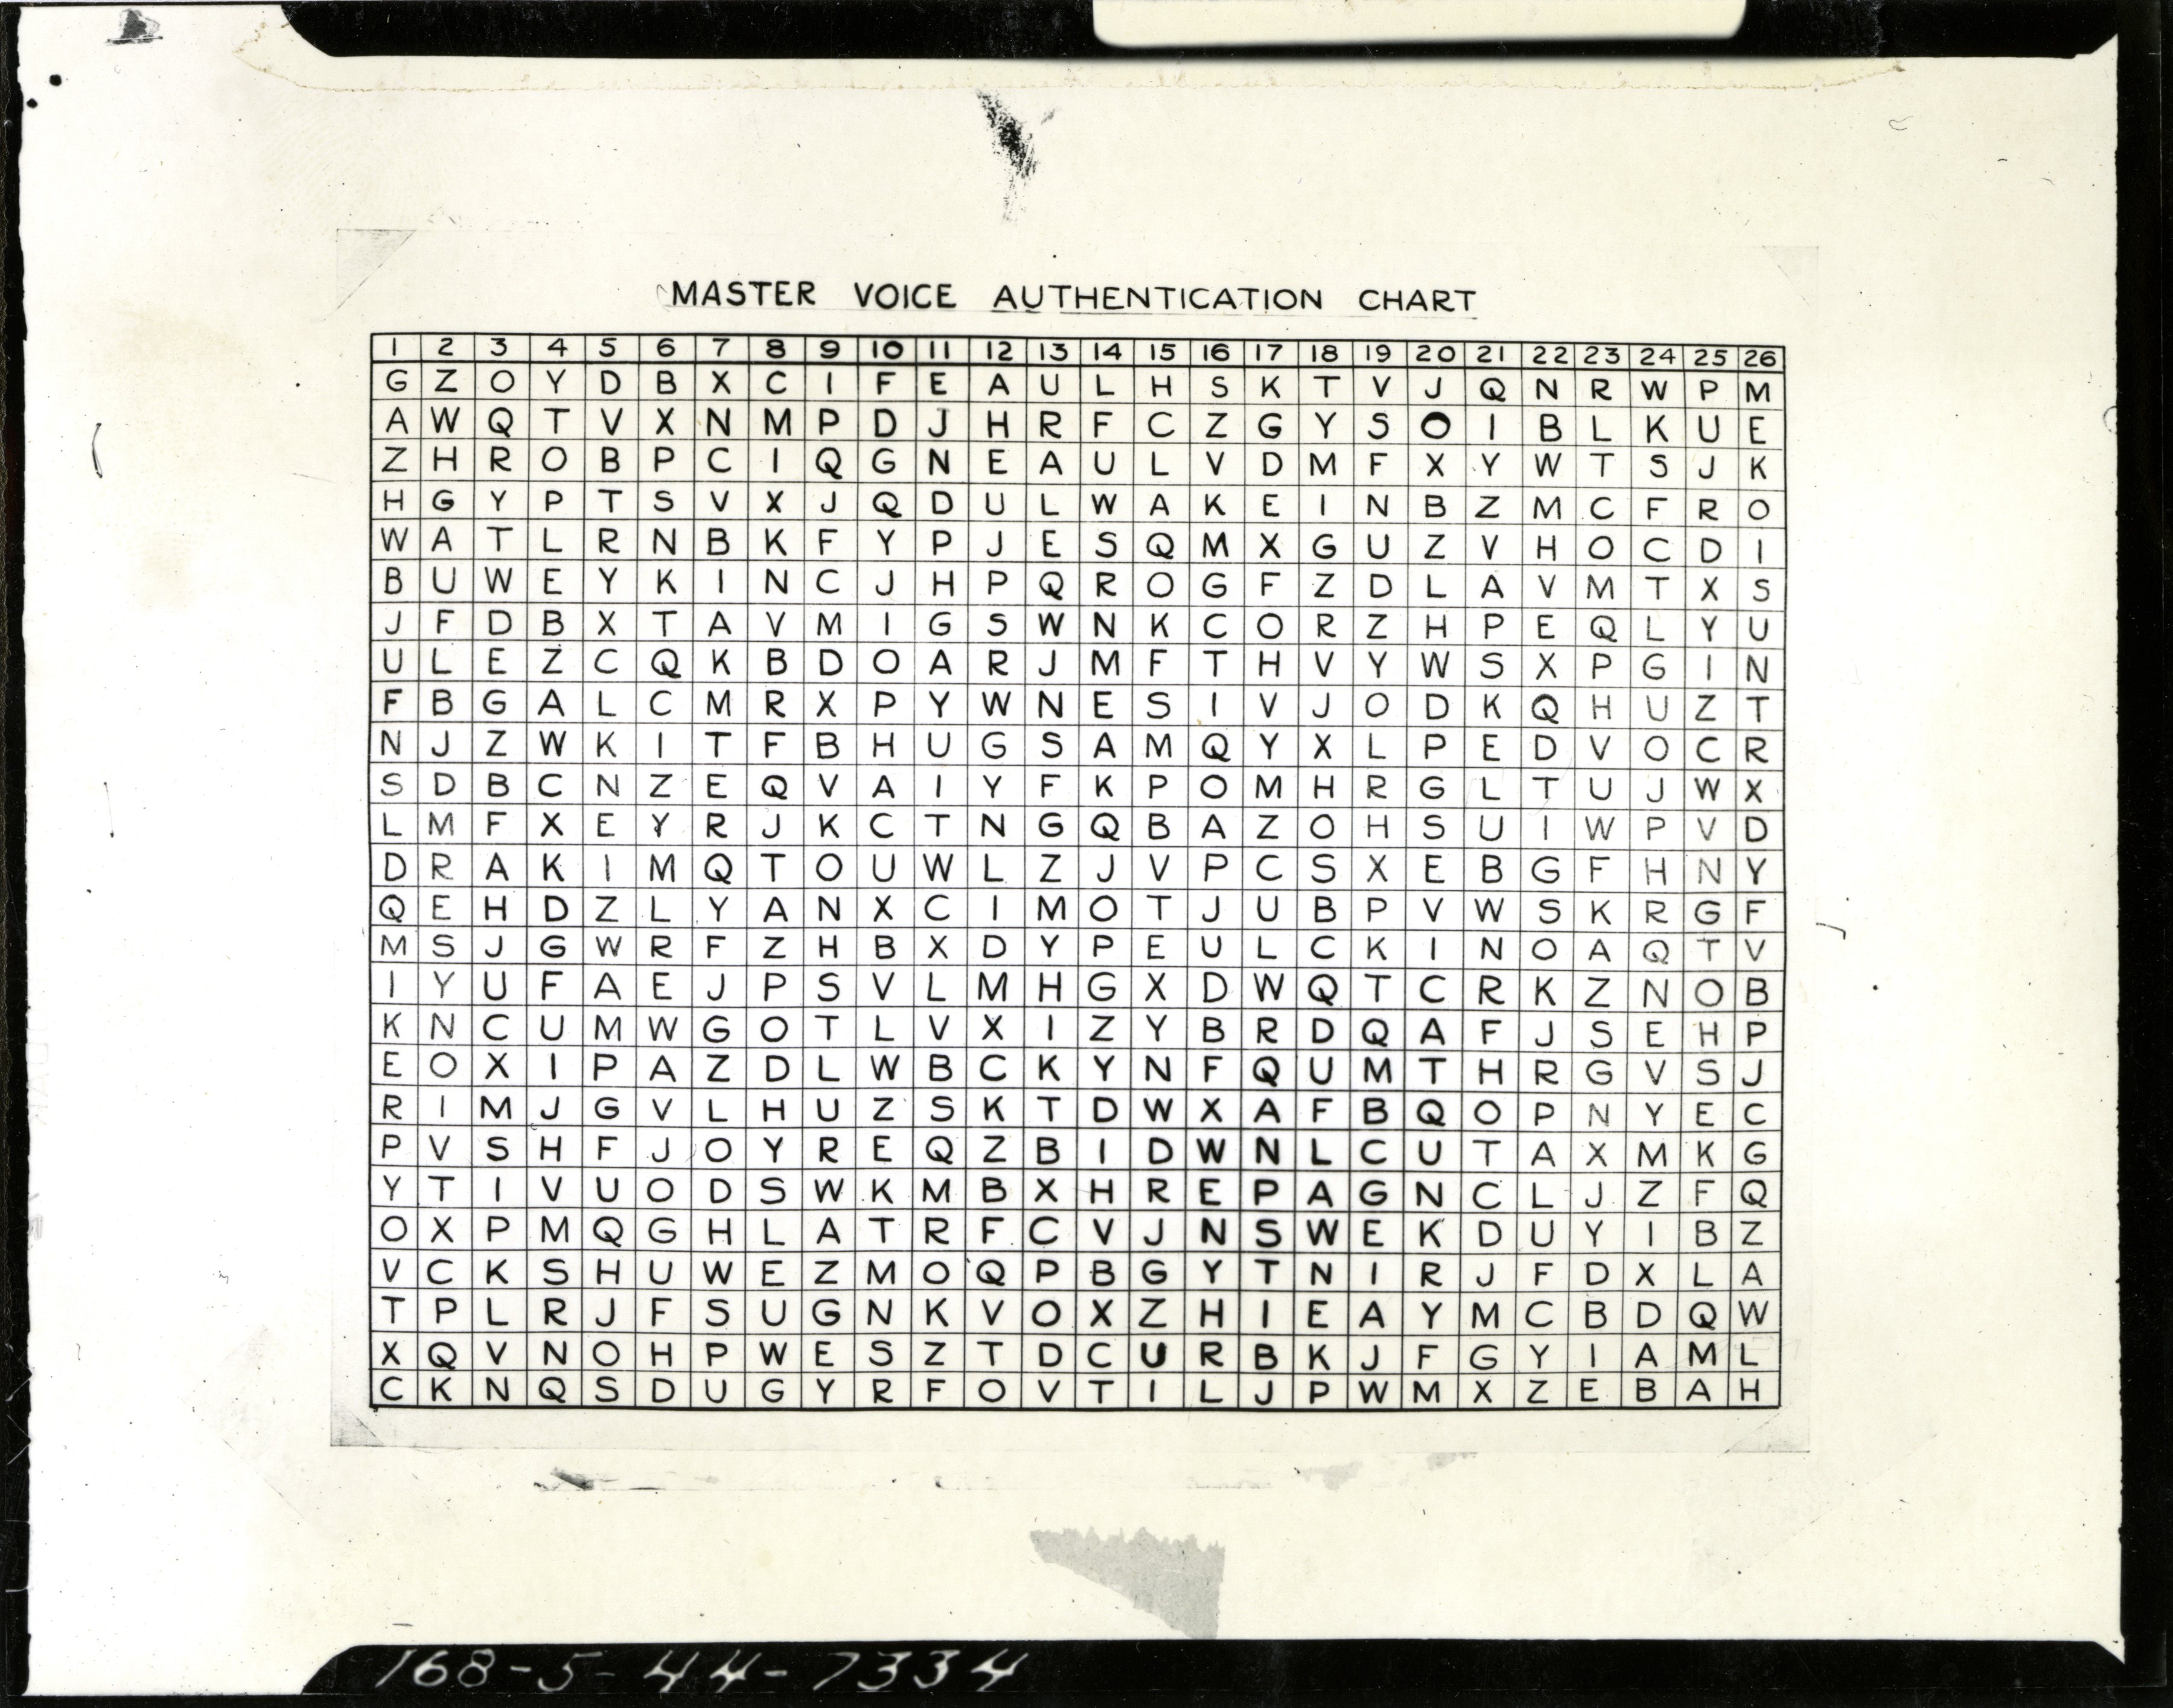
Copy for Lt Col Williams, Chief Signal Officer, 106th Infantry Division at Camp Atterbury, Indiana on 1 September 1944
2138. '1 Sept. 44 Barry. Copy for Lt Col Williams, Chief Signal Officer, 106th Inf Div, at Camp Atterbury, Indiana. 168...
Pages
1
2
next ›
last »